July 2, 1999 (in Japanese, on this site)
Aug. 26, 1999 (in English)
Preface
This case study was carried out at the USIT Training Seminar (held in March 1999) by a team of myself and Ravi Chona (Texas A & M Univ.) under the instruction of Dr. Ed Sickafus. This problem was brought in at the Seminar by myself. This report is written after redrawing the OHP sheets handwritten at the seminar and adding the texts for explanation to the readers, and is posted here.
In this Web site, I already posted the Participation Report of the USIT Training Seminar and USIT Case Study (1) Detect Small Water Leakage from a Gate Valve; please let me assume that the readers of this second case study already read them. The USIT methodology has two different methods for the problem analysis stage. The first method, i.e. the Closed World Method, was applied and described in Case Study (1), while the second method, i.e. the Particles Method, was applied in the problem described in this case study. Thus the two case studies reported in this Web site compliment each other to describe the overall structure of the USIT methodology.
As in case study (1), the ten participants formed four teams to solve each different problem brought in by one of the team members. The USIT's three problem solving stages were carried out in a clearly-separeted sequence; during each stage, instructor's short explanation, team practices in parallel, and team presentation and discussion were done as a set, as the day before. The three stages were problem definition, problem analysis with the Particles Method, and concept generation. We did all the three stages in one day from 8 am to 4 pm; thus our team actually spent only about 4 hours in total to do this case study.
The handwritten OHP drawings at the
seminar were redrawn four days later, and are shown here as the figures.
The present text was written recently for explaining the figures and adding
infortmation obtained during presentations and discussions at the seminar,
in order to make them readable as a case study.
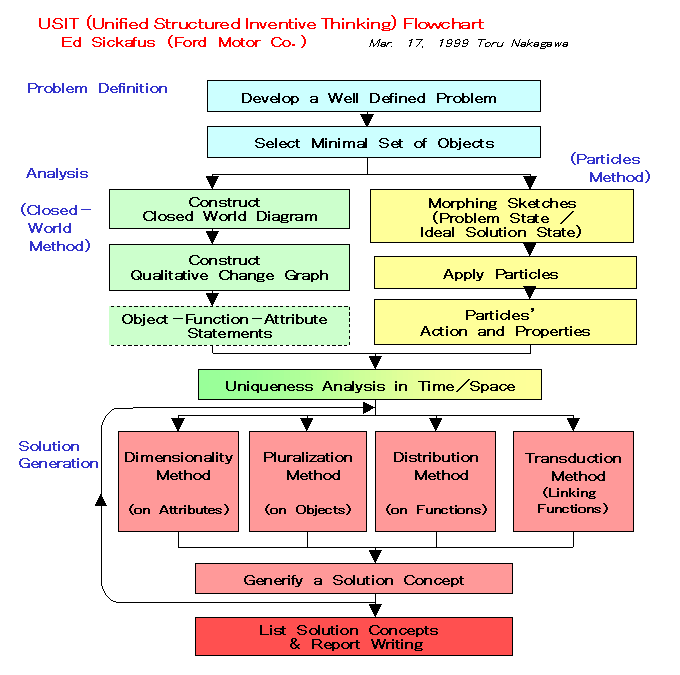
1. The USIT Flowchart
USIT (Unified Structured Inventive
Thinking) is a much simplified version of TRIZ and is represented by its
concise flowchart shown in Fig. 1. The whole process of USIT is composed
of three stages, i.e., Problem Definition, Problem Analysis, and Concept
Generation. In the Problem Analyis stage, there are two separate
flows, namely, the Closed-World Mehtod and the Particles Method; the latter
was chosen to apply in this case study. The whole problem solving
process described below were carried out along this flowchart.
 |
|
| . | Fig. 1. The overall flowchart of USIT (taken from Nakagawa's participation report (Mar. 30, 1999) of the USIT Training Seminar and slightly modified) |
2. Stage 1: Problem Definition (See Fig. 2)
Step 1-1: Explanation of the problem situation
For this case study, an actual technical problem in a preliminary experimental stage was brought in. The situation of the problem was explained in the seminar as:
"This is a problem to increase the foam ratio in forming porous polymer sheets. To form the polymer sheet, heated molten polymer is pushed out through a slit-shaped nozzle and pulled at the same time to expand and cool into sheet continuously. In the molten polymer, a kind of gas is desolved under high presssure. On pushing out through the nozzle, the polymer surface is cooled and confine the gas inside the polymer, while the release of the pressure make the gas form bubbles inside the polymer, thus making the polymer sheet porous, soft and cushionable. Some preliminary experiments, however, showed an problem in the foam ratio of the resulting sheet. In cases where the sheet should expand 10 times in volume if all the gas is used for making the foams, it was found that the sheet actually expanded only two to three times in volume. The present problem is to increase the foam ratio as much as possible, desirably up to the theoretical limit. "
In the actual problem, technical
details such as the polymer material, temperature of the molten polymer,
gas composition, high pressure for gas desolution, nozzle dimension, speed
of pulling the sheet, design of the apparatus, etc., are all known but
are not descibed here in the case study report. The USIT methodology
itself does not concern such technical details, but it handle the problems
as "conceptual" as shown in the above example and try to solve them on
the "concept level".
Step 1-2: Problem statement
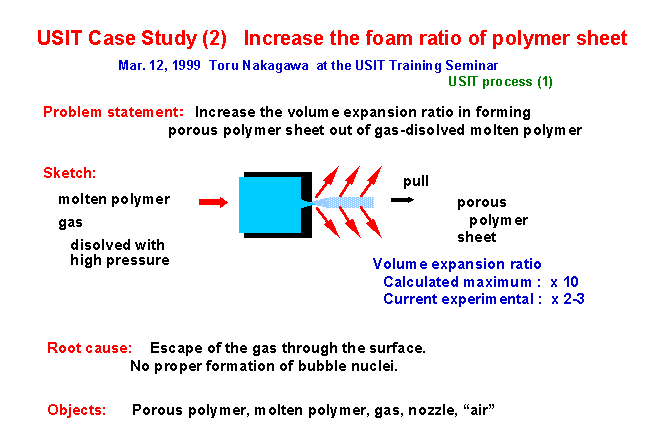
On the basis of the above explanation
of the problem, the problem was defined in a concise "Problem statement",
as shown in Fig. 2.
 |
|
| . |
Fig. 2. The OHP drawing written during the Problem Definition Stage (Stage 1) |
The readers, who read the problem explanation (in Step 1-1) and then this problem statement (in Step 1-2), may feel that this step is just shorten an explanation of several sentences into one sentence. The real process is not so simple but contains much more work: The engineers actually working on this topic have a variety of intentions, targets, difficulties, and problems under complicated situations. From such a complex of situations, only one problem was extracted to solve and was stated in the single "problem statement"; as a matter of fact, the explanation in Step 1-1 was just a summary of the background related to the problem focused in Setp 1-2. Focusing our attention only to one problem is important in order to increase our productivity and depth in the problem solving. If you have other problems, you should better reduce them into another "single problem" to solve one by one; this is the strategy recommended in USIT.
Step 1-3: Sketch
The problem is sketched in a simple manner as shown in Fig. 2. It simply shows the region where the molten polymer is pushed out by high pressure through a nozzle. Mechanisms and instruments for melting the polymer, for disolving the gas with high pressure, for pushing the polymer, etc. are all omitted as they are not relevant to the present problem. The simplicity of this sketch (and the focusing of the problem) probably reflected the training on the previous day (i.e. reported in USIT Case Study (1)).
Step 1-4: Pointing out the root cause
The root cause I pointed out for this problem was "Escape of gas from the surface" and "Foams do not grow larger".
We need to be more careful in this step. We should reconsider whether the escape of gas is a "cause" or a "result". The amount of gas contained in foams in the product polymer sheet is known by the volume expansion rate. The rest amount of gas can only get out of the polymer sheet from the surface. Thus, it is a fact that most part of the gas has escaped, as a result, from the polymer surface. However, it is questionable if the escaping is the real (or the root) cause. This question was raised by the instructor and other participants at the seminar. Similarly, my listing of "Foams do not grow larger" as a root cause also has similar problem.
The more deeply we understand the "root casue", the more properly we would be able to solve the problem. This urges us to examine the root cause deeper and deeper; such examination would request a variety of observation, experimental results, and technical information. Phenomenological understanding, such as shown above, however, may provide us some guiding principles, as far as the understood phenomenon is a fact in the mainstream of the problem's causal relation ship. In this sense, it is not necessary to stop applying USIT becasue of the lack of confidence in the root cause. We should understand the importance of finding the root cause; and at the same time of trying to solve the problem with sound hypotheses.
Step 1-5: Selection of objects
Then we listed up the objects (i.e.
components in the problem system) necessary to describe the problem system.
The porous polymer sheet as the target product, the molten polymer as the
raw material, the gas disolved with high pressure, and the nozzle as the
apparatus were listed. In Fig. 2, we include "air"; the " " mark
here represents an object which is available in the environment readily
and cheeply, though we apt to fail to notice.
3. Stage 2: Problem Analysis (Particles Method and Uniqueness Analysis)
In the Problem Analysis stage, we applied the Particles method to this case study. This method was adopted from Altshuller's "Smart Little People Method" in TRIZ. By imagining we would have magical little people or magical particles, we are going to consider what we could ask them to do for us to solve the problem. The "Closed World Method", which we used in Case Study (1), tries to improve the current system in problem. The Particles Method, on the other hand, is suitable to apply to the cases we do not have a proper base system or to those where we would like to consider more freely. The present case fits this characteristics of the Particles Method and has provided us a good example, I believe.
Step 2-1:
Sketch of the problem state and the ideal solution state (See
Fig. 3 upper part)
 |
|
| . |
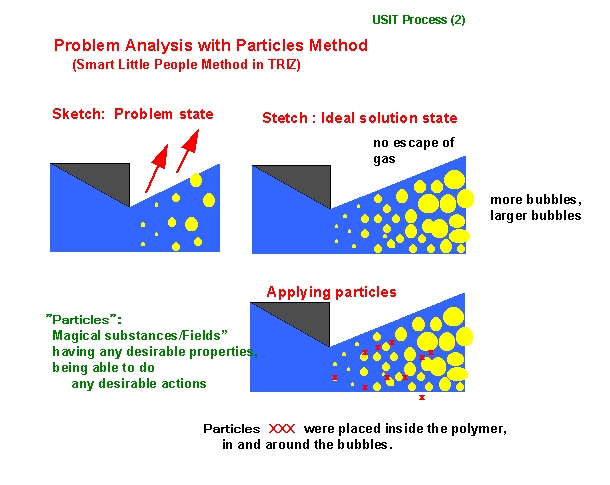
Fig. 3. Steps 2-1 and 2-2: Problem Analysis stage; Problem state, Ideal solution, and applying the particles. |
Step 2-1-1: Sketch the problem state (See Fig. 3, upper left)
In the Particles Method, we first sketch the current state of the problem. The sketch in Fig. 3 shows the situation in the neighborfood of the nozzle. The configuration of this sketch was advised by the instructor, Dr. Sickafus. It shows only the focused area in the problem; the essencial area of the sketch in Fig. 2 is enlarged to show in Fig. 3. It shows that a part of the disolved gas contributes partly to make foams, but other part (possibly most part) is escaping from the surface. The sketch may be simple, qualitative, and abstract.
Step 2-1-2: Sketch the Ideal Solution (See Fig. 3, upper right)
This step is important in USIT. We are going to draw the state where the problem is solved in an ideal way. In the present case study, the gas disolved in the molten polymer generates the foams. Since all the gas turns into the foams, we would ideally have much more foams and probably larger (to some extent) foams. Gas should remain in the polymer sheet in the form of foams and no part of it should go out of the sheet, in the ideal solution.
This sketch does not (and must not) show how such an ideal solution can be achieved. For example, you must not try to show means to confine the gas, such as changing the nozzle shape and forming walls of the instrument.
Step 2-2: Apply the particles in the fugure (Fig. 3, lower)
After copying the stech of the ideal state, we next apply the Particles at some proper places in the figure with the x marks. "Proper places" are usually the places where clear differences are observable in the two sketches; they are the places where some change should occur for realizing the solution. In the present case, as shown in Fig. 3, I put the x marks inside the polymer being pushed out, in and around the foams, near the surface inside the polymer, etc. (Though I did not, I might put them on the surface (outside) of the polymer, because that part has a change of deminishing the gas flow.)
"The Particles" may be regarded as magical substance and/or "Field", which may have any property and can do any action. What properties they should have and what actions they should do may be considered later. They can do anything on "Master's" order (i.e. the problem solver's order). Though Altshuller called them "Smart little people", the SIT developers in Israel renamed them the "Particles". The reasoning of the renaming was to avoid the analysers from unconsciously declining of putting the "Smart little people" in severe and harzardous situations (e.g., in highly reactive acids).
Even though the Particles are regarded as magical substances and/or "Fields" which can do anything, they observe the natural raws on their final bases. If they are substaces to do some action, such substances must be brought in or generated. If they are local electric fields for giving some influences, they must be generated with some equipment or setting ups. Thinking of the targets first of these magical Particles and thinking of the realizing means later is the essential way for this Particles Method. Nevertheless, they must be realized by use of, and under the restrictions of, the raws in nature. This point is the difference from the "Magic" in fairy tales.
Step 2-3:
Clarify actions and properties desirable for the Particles
(See Fig. 4)
 |
|
| . |
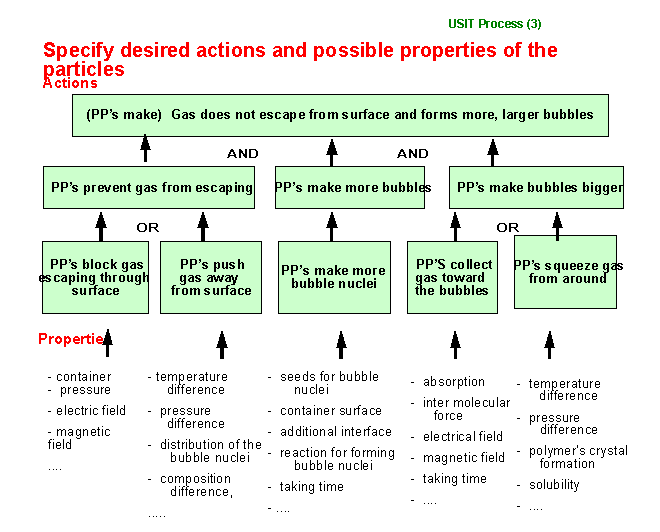
Fig. 4. Actions and properties desirable for the Particles (Step 2-3) |
Step 2-3-1: Clarify the actions to be achieved by the Particles in the form of an AND/OR tree (See Fig. 4, upper part)
Now we have to clarify the actions we want the Particles to do for achieving the ideal solution. First, at the top, we write the action in a single statement. We should better use simple, nontechnical words in this statement, because formal and technical words are often associated with some technical concepts and means and hence they apt to restrict our thinking range. If the stated action is composed of multiple elements of actions, then such elements of actions should be decomposed and written down individually at the lower level together with the "AND" or "OR" operators for specifying whether both or any one of the element actions need to occur. The actions to be performed by the Particles can further be broken down into lower-level elements. In this way, the Particles' actions are wirtten in a tree structure, named "AND/OR Tree" in USIT. [I personally prefer the terminology of "Particles' Actions/Properties Diagram" to the AND/OR Tree, because the former stands for the purpose of the diagram and is more meaningful to remember.]
During the above process of decomposing the actions, each element of action may be decomposed without considering the correlations to other elements. Three or four levels are usually enough for the decomposition. Simple, nontechnical words should be used in describing the actions, so that they do not imply specific technical means. Simple words are more stimulative to think of a variety of realizing methods. For example, in the right part of Fig. 4, the target action of "to make the bubbles larger" is decomposed into two lower-level actions; they are "to collect the gas into the bubble" (associative to the actions inside the bubble) and "to squeeze the gas from around" (associative to the actions outside the bubble).
Step 2-3-2: Listing up desirable properties of the Particles (See Fig. 4, lower part)
After decomposing the actions to be achieved by the Particles, we next list up possible desirable properties of the Particles for performing each element of actions at the ends of the AND/OR Tree. During this process, the correlation between the actions need not be considered. We should list up the desirable properties as flexibly in thinking as possible, in somewhat abstract way (i.e. not in a concrete and specific way), without restricting ourselves with feasibility consideration.
In the present example shown in Fig. 4, we are searching in our mind for the properties to achieve the action "to block gas escaping through surface", and are thinking of "a container", "pressure" higher at outside the surface, "electric field" to push the gas back from the surface (assuming with some electricity on the gas), and maybe "magnetic field" in a similar way, etc. During this process, the thinking way may not be so exact, but should be rather free and widely spread. For example, the use of magnetic field for blocking gas from escaping through the surface may be applicable only very limited cases and would need extreme experimental conditions; but it is all right to list it up at this stage.
In Fig. 4, with respect to the Particles' action "to make more bubble nuclei", we are listing up the properties such as: "seeds for bubble nuclei", "container surface" enhancing the buble formation, "additional interface" in place of the container surface, "reaction for forming bubble nuclei", and "taking time" to make more bubble nuclei. During listing up these items one by one, in our mind we are often stimulated with some ideas which may form elements of solutions at the next stage (i.e., concept generation stage); thus it is important to remember such ideas and express them with proper keywords in the diagrams of Fig. 4.
Step 2-3-3: Analysis of initializing and terminating of the Particles
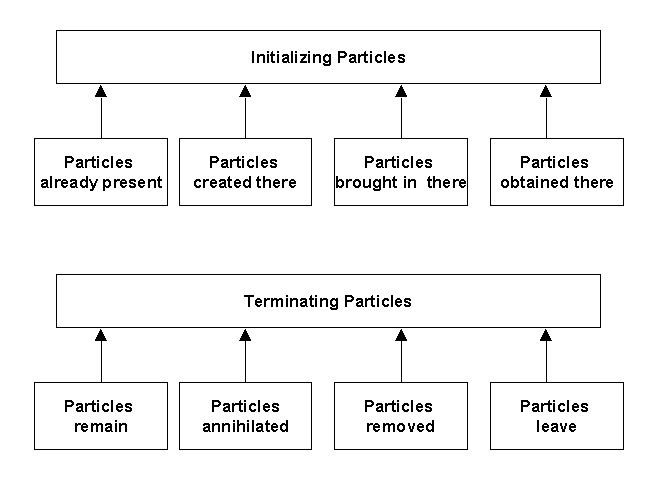
Though not explicitly done in the present case study, it is necessary to consider the initializing and terminating the Particles, because the Particles are substances and/or "Fields" which obey the natural laws. Initialization is the pre-process for making the Particles available and useful; you have to clarify possible methods of introducing the substances and/or "Fields" as the Particles. Since the Particles are not "Magic Particles" in fairy tales and have to obey the natural laws, this initialization needs to be considered. Similarly, we have to consider the termination of the Particles.
For initialization and termination
of the Particles, we may draw, if necessary, diagrams similar to Fig. 4.
The action part of the diagrams of initialization and termination are already
standardized as shown below. The properties desirable as the Particles
may by written at the bottom of these diagrams in a way similar to Fig.
4.
| . |  |
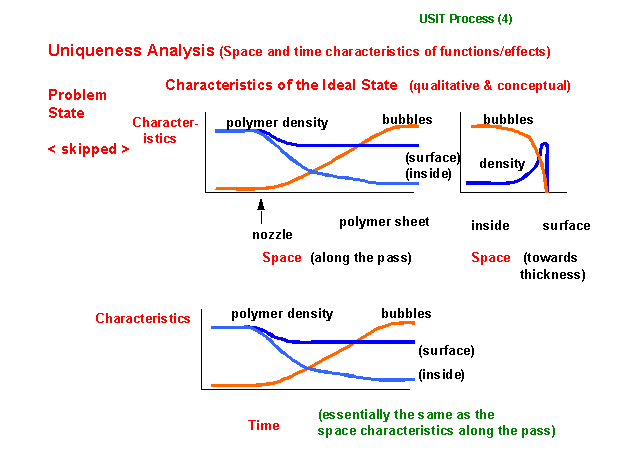
Step2-4: Uniqueness analysis: space and time characteristics of the functions (See Fig. 5)
After applying the Particles Method
as the main process of problem analysis, we apply the Uniqueness Analysis
as the latter half of the problem analysis (in a way similar to the cases
where the Closed World Method was applied, as in Case Study (1)); see the
flowchart in Fig. 1. The purpose of this step is to clarify the space
and time characteristics of the problem' s effects and functions.
 |
|
| . |
In the present case study, we skipped describing the characteristics of the problem situation, and analyzed immediately the characteristics of the ideal solution. The space characteristics are drawn in the upper two graphs of Fig. 5. First we examined the charcteristics along the axis (i.e., the direction of pushing out the polymer). The bubbles are born at the nozzle position (i.e., at the posotion where the high pressure begins to be released), increase in number and in size, and stop their change where the polymer gets cool and forms the product sheet. As another characteristic, we considered the polymer density, i.e., a quantity inversely proportional to the local foam ratio. It has a certain value for the molten polymer at high pressure, decreases with the formation of bubbles, and becomes a small value for the foam sheet. From the viewpoint of the overall foam ratio of the product, we considered the bulk density of polymer inside the sheet, at first.
We then considered in the relation that we thought (in the analysis in Fig. 4) of the method "not to make bubbles on the surface" in order to prevent gas from escaping through the surface. For this purpose, our ideal solution requires that the bubbles should be less near the surface and hence the polymer density should be kept at a certain (not too small) value. This consideraion is expressed with the curve represented by "density (surface)" in the upper-left graph in Fig. 4.
In order to show this consideration more clearly, the space characteristics along the thickness of the sheet was analyzed as shown in the upper-right graph in Fig. 5. The bubbles should distribute much and homogeniously inside the sheet, and they become less suddenly near the surface. The polymer density, being inversely propotional to the bubble distribution, is small inside while large only near the surface.
The graph at the bottom in Fig. 5 shows the time characteristics. A small portion of the molten polymer is traced for some time and shown in the time scale. It is molten under high pressure at first, and then is pushed out through the nozzle, forms bubbles inside, and turns into the porous polymer sheet. Thus the time characteristics is found qualitatively the same as the space characteristics along the axis. Nevertheless, the bottom graph in Fig. 5 shows the view along the time; after taking some time, the bubbles are formed, increase in number, become larger, and stay in a constant state. This analysis helped us realize that the formation and growing of bubbles take some time and that the distance from the nozzle along the axis essentially represents the time of bubble formation.
I would like to comment here that
we did NOT draw what we knew beforehand in these graphs in Fig. 5.
Given the framework of the processes of drawing space characteristics and
drawing time characteristics, we were forced to consider how to draw them
in the specific problem. The framework of the process urges us to
consider step by step; thus we consider what and how to draw, find some
new points, and decide every detail in the graph. These small steps
of considerations and decisions result in graphs shown in Fig. 5.
USIT's problem analysis contributes to problem solving in this manner,
by urging the analyzers to think, by helping them find new recognition
through the thinking process, and by requesting them to represent the recognitions
explicitly in figures and diagrams.
4. Stage 3: Concept Generation for Solving the Problems (See Fig. 6)
[In the USIT Training Seminar, four problems were handled in parallel on its third day. The problem definition stage was done in the morning, then the problem analysis stage in the morning and early in the afternoon, and finally the concept generation stage in the afternoon until 4 p.m. Our team was late in finishing the problem analysis and decided to complete it even in the time frame for the concept generation. Thus, the part of the present case study described so far was actually written in OHP sheets, presented and discussed in the Seminar. Through the analysis and its discussion, I had formed ideas of solution concepts in my mind almost in a complete form at the Seminar day; the instructor, Dr. Sickafus, also had such ideas in his mind, I suppose. The concepts shown here in Fig. 6 was written on March 17, after a few days of my return from the TRIZCON99/USIT Seminar trip.]
The third stage of USIT is to generate
concepts for solving the problem, on the basis of the analysis so far,
and to write them down. As shown in the flowchart in Fig. 1, USIT
has the following four problem solving techniques (Also see Case Study
(1)).
(a) Dimensionality
Method: Focuses on the attributes.
(b) Pluralization Method:
Focuses on the objects.
(c) Distribution Method:
Focuses on the functions.
(d) Transduction Method:
Focuses on the links of attribute-function-attribute.
These techniques may be used as
you think most suitable depending on the problem situation. USIT
does not say much about the order and manner of using them.
As a matter of fact, in the present
case study, I did not have any sense of which one of the techniques I actually
used. As described above, during the process of listing up items
for the diagrams and drawing the graphs in the analysis stage, a number
of elements of ideas were born in my mind. When I wrote Fig. 6 (and
some more detailed report) after 5 days from the Seminar, I just wrote
them down in a categorized way. I wrote the elements of ideas in
keywords or in sentences, and clarified the structures among them.
Then I added some more ideas in the structure. This process of concept
generation was not conceived as application of any specific solution technique,
but rather was a typical work of report writing; it was similar to write
a plan proposal and an outline of a paper.
 |
|
| . |
Fig. 6 Concept generation (OHP sheet drawn in Step 3) |
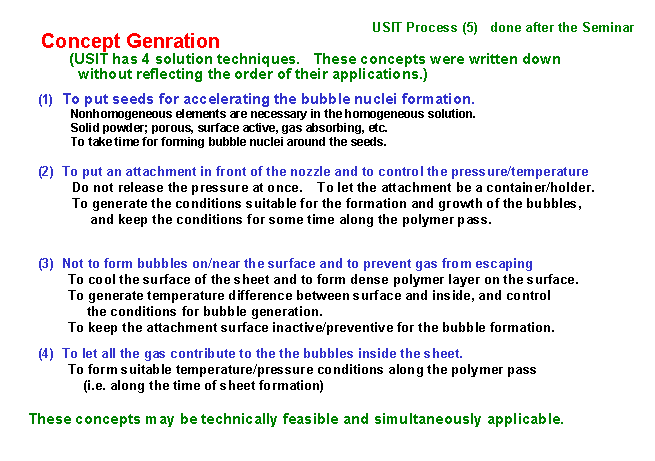
Some points are noted here in relation to Fig. 6.
(1) The solution "to put seeds for accelerating the bubble nuclei formation" intends to generate the bubbles as many as possible in the initial stage of bubble formation. The comment "Nonhomogeneous elements are necessary" is the conclusion I obtained from the discussion by Dr. Sickafus.
(2) The solution "to put an attachment in front of the nozzle" is a means to control the basic conditions such as pressure and temperature, for the purpose of promoting the formation and growth of the bubbles inside the polymer. The Particles may not be substances but "Fields" (in the TRIZ terminology, forces, fields, interactions, energies, environmental conditions, etc. are genericly called as "Fields"); the "attachment" in this solution intends to realize such "Fields" in some specific way. I wrote it as an attachment, with the hope that such part of equipment may be easily changed for realizing a variety of experimental conditions controllable and suitable for each case of actual application.
(3) The solution "not to form bubbles on/near the surface" has led to a more specific concept "to form a dense polymer layer on the surface" in the early stage. This intends to implement the space characteristics along the depth of the polymer sheet, which was clearly recognized in the Uniqueness analysis (in Step 2-4).
(4) The concept "to let all the gas contribute to the buble inside the sheet" means the foam ratio becomes equal to its theoretical value; hence it means the Ideal solution. This is the target for solving the present problem, and the concepts (1) through (3) in Fig. 6 may be regarded as more specific means for achieving this target. For achieving the target, the concepts in (4) point out that it is important to construct and keep the environment of the formation and growth of bubbles and to take time for the bubble formation/growth. It is the solution concept related to the time space of the problem.
The four main concepts described
in Fig. 6 can be applied at the same time and can form a unified solution
as a whole, I believe.
5. Concluding Remarks
The present case study tried to solve with USIT a real problem which was in its initial experimental stage. By using the Particles Method in the problem analysis stage, it succeeded in generating multiple solution concepts. The Particles Method is shown to be useful for this focused problem, for analysing the problem from a general viewpoint and for providing valuable concepts for solving the problem.
In fact, I got aware of this specific problem several months before the Seminar and thought of it from time to time. I am not a specialist in this field and never at a position responsible for solving it. In the USIT Training Seminar, using the USIT methodology and discussing with Dr. Sickafus, I obtained the solution concepts shown in Fig. 6 essentially in one day. A week after the seminar, I explained about this case study to the manager of the engineering group of this problem. On hearing it, the manager said: "The individual ideas shown in Fig. 6 have been known, and the concepts seem orthodox". For the problem which was almost in the mist in its preliminary stage of experiments, this case study of USIT has shown a clear direction of solution, as was commented seemingly orthodox; this must be remarkable. Technical examination and experiments are now under way.
I would like to say one more point
in relation to the above comment by the manager: It should be clearly
understood that "creative" problem solving does not mean (or does not evaluate)
to obtain "strange" solutions. Dr. Ed Sickafus set the aim of USIT
as to generate multiple concepts to solve real problems in industry as
quickly and creatively as possible, rather than to invent. Real inventions
take years or decades to succeed technically and in business; but industries
want "creative problem solving" which can be implemented much sooner, e.g.
in months. The present case study has well realized such a aim of
USIT creatively.
I wish to express my sincere thanks
to Dr. Ed Sickafus for his thoughtfull guidance and valuable discussion
on this case study in the seminar. I am also grateful to the Japanese
company that allowed me to post this case study taken from their real problems.
I wish that these two case studies of USIT are helpful to many people who
want to understand USIT and TRIZ better and to apply them to their creative
problem solving.
| Top of this page | USIT
Seminar
Report (Mar. 99) |
Case Study (1) | Sickafus
paper
(Nov. 98) |
Sickafus
paper
(Mar. 99) |
Japanese
page |
| Home Page | New Information | Introduction to TRIZ | TRIZ References | TRIZ Links |
| TRIZ News & Activities | TRIZ Software Tools | TRIZ Papers and Tech Reports | TRIZ Forum |
Last updated
on Aug. 26, 1999. Access point: Editor: nakagawa@utc.osaka-gu.ac.jp