July 2, 1999 (in Japanese, on this site)
Aug. 26, 1999 (in English)
Preface
This case study was carried out at the USIT Training Seminar (held in March 1999) by a team of myself and Ravi Chona (Texas A & M Univ.) under the instruction of Dr. Ed Sickafus. The problem was presented at the Seminar by Ravi Chona. Under his permission, this report is written after redrawing the handwritten OHP sheets and adding the texts for explanation for the readers, and is posted here. I hope this case study is illustrative for the readers to understand how to apply USIT to practical problems.
In this Web site, I already posted the Participation Report of the USIT Training Seminar. Overviews of the USIT methodology and of the seminar described in it should be helpful for the readers to understand this case study better. Another USIT case study is posted in this Web site at the same time with the title of "USIT Case Study (2) Increase the Foam Ratio in Forming a Porous Sheet from Gas-Solved Molten Polymer". These two case studies have applied the two different analyis methods in USIT, and thus complement with each other for fully understanding USIT.
The present case was studied on the second day of the above mentioned three-day seminar. Ten participants made four teams to solve each different problem brought in by one of the team members. The problem solving was carried out in three separate stages corresponding to the USIT flowchart, i.e., problem definition, problem analysis, and concept generation stages. In each stage, the instructor first explained how to proceed, then the four teams tried to solve their own problems in parallel, and finally the teams gave presentations by turns by using handwritten OHP transparencies to all the participants for discussion and instructor's advice. All the three stages were done in one day from 8 a.m. to 5 p.m. Thus our two-membered team actually spent on this problem only three hours or so in total.
The handwritten OHP drawings at the seminar were redrawn five days later, and are shown here as the figures. The present text was written recently for explaining the figures and adding presentations and discussions at the seminar, in order to make them readable as a case study.
1. Overview of the USIT methodology
USIT (Unified Structured Inventive Thinking) is a much simplified version of TRIZ and focuses on the initial, concept generation stage in the technical problem solving. In 1980s Israeli people much simplified TRIZ to form SIT (Systematic Inventive Thinking); and since 1995 Dr. Sickafus introduced SIT into Ford Motor Co. and refined it into USIT. The rationale of introducing SIT into Ford and the current USIT activities in Ford were reported in detail by Dr. Sickafus in latest academic TRIZ conferences. His two papers were translated into Japanese and are posted in this "TRIZ Home Page in Japan".
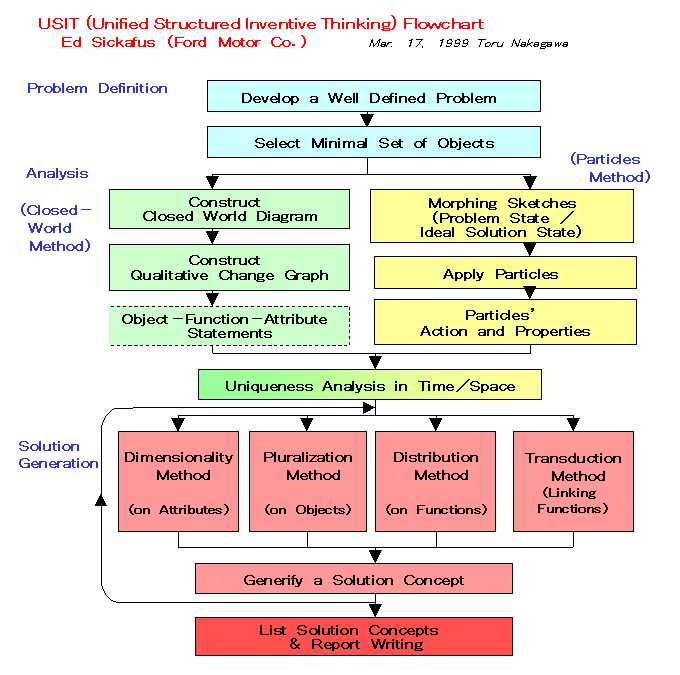
The USIT methodology is well represented
by its concise flowchart of the whole process. The flowchart is shown
below in Fig. 1, being taken from my seminar report. The USIT methodology
is applied in clear separate steps as shown in this flowchart. The
steps carried out for the present problem are explained below in detail.
 |
|
| . | Fig. 1. The overall flowchart of USIT (taken from Nakagawa's participation report (Mar. 30, 1999) of the USIT Training Seminar and slightly modified) |
2. Stage 1: Problem Definition (See Fig. 2)
Step 1-1: Explanation of the problem situation
First of all, the situations of the problem were explained by the member (Mr. Chona) who brought in the problem. They may be summarized as:
"This problem concerns testing methods at the final stage of producing high-pressure gate valves. The gate valves are manufactured with high-precision machining and must be tested on any leakage at the final stage of the production. The gate valves are used for oils, gases, and many others in the fields, but they are tested on leakage with water for the sake of convinience. We want to test them by applying high pressure and examine if there is any leakage at the level down to 2 to 3 water drops per minute. During the test nothing is connected to the low-pressure side of the valve; so you may assume that you can directly watch the inner wall of the low-pressure side of the valve."
Step 1-2: Problem statement
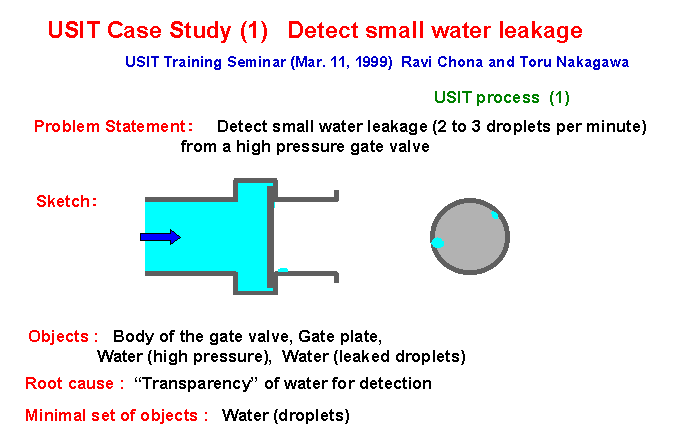
On the basis of the explanation of
the problem situations, a problem statement should be written as a concise
statement. During this process, it is important to focus on one problem
only. The focal point to be solved in the problem and the purpose/target
of the task should be stated. (See Fig. 2)
 |
|
| . |
Fig. 2. The OHP drawing written during the Problem Definition Stage (Stage 1) |
Step 1-3: Sketch
The problem should be sketched with simple illustrations, as in Fig. 2. In this sketch, it is not necessary to draw technical details, e.g. shape and dimensions of the valve. The member who presented this problem of course knew much more details of the valve structure, but the essence of the problem can be shown adequately in the simple sketch such as Fig. 2. The right sketch in Fig. 2 represents the valve observed from its low-pressure end, and shows that the water slightly leaks at spots of the circuference.
Step 1-4: Selection of objects
Then we list up the objects (i.e. components in the problem system) necessary to describe the problem system. In this step, the objects are listed up without severe selection (See Fig. 2).
Step 1-5: Pointing out the root cause
Then it is advised to clarify the root cause of the problem, or the root cause of making the problem difficult. If one makes an erroneous understanding of the root cause, all the efforts for problem solving will be lead towards wrong direction. It is important to observe the situations in the problem in an objective manner and to understand the facts and their relations.
In this case, I first wrote as the root cause that "water is transparent". I simply meant water is not easy to see because it is transparent. The instructor advised me: 'When you say water is transparent in seeing, you unconsciously assume your detection methods too narrowly. You should consider a variety of method to detect the water. You would better enclose the word transparent with " " '.
Step 1-6: Select the minimal set of objects
Going ahead one step further from step 1-4 where we listed up the objects, we should select the minimal set of objects that are necessary to describe the system in the problem. We are urged to eliminate the parts which are not essential for the problem statement. In this case study, we concluded that only the water (droplet) is the minimal and adequate set of objects in this problem system.
The recognition of the problem in this step is important. We first started this case study as "a problem of examining the gate valve", but in the course of the problem definition with USIT, we reduced the real problem we should solve into "the detection of water (or water droplets)", i.e. to detect a small amount of water, such as a few droplets. The original target of the problem was to detect the small amount of water leaking from a gate valve at the test stage of manufacturing; but when we consider the problem in its essence, we have found that neither the shape and structure of the gate valve, nor the high pressure applied to the water, nor even a gate valve are relevant to our real problem solving. Our only problem is to detect small amount of water slowly leaking from a component.
This kind of focusing of the problem
gives us two important effects. Firstly, it makes our idea generation
wider and more flexible in the problem solving. Secondly, it makes
us fully realize that any solution obtained can be applicable not only
to the original problem but to much wider group of problems.
3. Stage 2: Problem Analysis (Closed-World Method and Uniqueness Analysis)
In the second stage of USIT, we analyze the problem more closely. As shown in the fowchart of Fig. 1, USIT has two branches of problem analysis. The one is the Closed-World Method which was applied in this case study, and the other is the Particles Method which was used in the second case study reported separately. Any of them, and both of them, can be utilized in any problem. Generally speaking, however, the Closed-World Method is suitable to the problems where the current system exists with some difficulty/problem and is desired to be improved. The Particles Method, on the other hand, is applicable even to the problems where the way and the system to realize the given target/purpose are not known at all. In the present case, we determined to use the Closed-World Method before selecting the problem; this happened to be the right choice.
At the latter half of the Problem Analysis stage, the Uniqueness Analysis is always used.
Step 2-1: Closed-World Method: Construct the Closed-World Diagram (See Fig. 3)
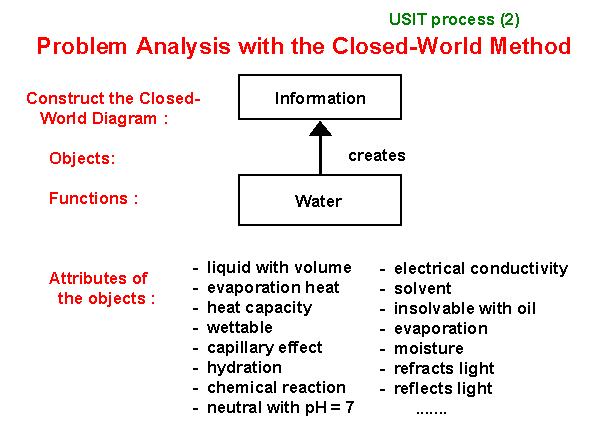
In the Closed-World Diagram, we first describe the system of the problem in the form of "Closed-World Diagram". By using the minimal set of objects selected at Step 1-6, the system and its function are represented.
Here we should better refer the USIT's
definition of objects, attributes, and functions:
Objects: nouns, exist by themselves,
and interact with each other to modify (or prevent) their attributes,
Attributes: adjectives, and
characterize the objects
Functions: verbs, and represent
interaction of objects
 |
|
| . |
Fig. 3. Step 2-1: Closed-World Diagram in the Proble Analysis Stage (OHP drawn in Step 2-1) |
Step 2-1-1: Decide the upper/lower relationships among the objects
In the Closed-World Diagram, the
objects composing the system are arranged vertically according to their
importance for realizing the functional purpose of the system. If
Object A is placed just above Object B in the diagram, the following five
conditions must be saticefied at the same time:
(a) Object A is more inportant
than Object B;
(b) Object B is related beneficially
to Object A, and it modifies (or prevents) Object A's attributes;
(c) Object B is in physical
contact with Object A;
(d) Object A is the main reason
for the existence of Object B -- if Object A is removed, Object B becomes
redundant;
(e) Object A came first in
the original design of the system.
For the present case, we had only one object, i.e. water (droplets), in the minimal set of objects selected in Step 1-6. But if we drew the only one object in the diagram, we could not express the original intention of the present system. Thus, the instructor advised us to introduce "Information" as the principal object at the top of the diagram, as shown in Fig. 3. This means we understand that the purpose of the present system (i.e. the testing system) is not the water droplet itself but rather the information that there exist a water droplet.
Here the "Information" is handled as an object; this is done for the sake of convenience in USIT after many practices. It was found in practice that the treatment of the "Information" as a kind of object makes the system representation easier and more expressive. This point corresponds to the choice of two system representations in TRIZ; one is the form of "two objects with an interaction" and the other the form of "one object and its measurement". To represent the latter form, the USIT methodology has introduced the expression that an object of the system generates a so-to-speak object, the "Information".
Step 2-1-2: Clarify the functions in the Closed-World Diagram
Next, we clarify the functions between the objects having direct upper/lower relationships. Only one function is specified for each directly connected pair of objects. This simplification, or rather restriction, urges the analyzer to clarify the original design intention of the system. Simpler representation of the diagram is the key to understand the essence of the system. The more simply one understands the essence of the problem, the wider and the more flexible concepts one can obtain in solving the problems. This is a basic understanding in the USIT philosophy.
Step 2-1-3: List up the attributes of objects in the Closed-World Diagram
For each object in the Closed-World Diagram, we should next list up a variety of their attirbutes. It is advised to list up as many and wide range of attributes as possible; i.e., not only those apparently related to the functions of the objects but also those seemingly not relevant at moment. Such attributes may be listed below the objects as shown in Fig. 3.
The Closed-World Diagrams represent the intention of the original designer of the system in problem. They do not show at all which components or which functions are deficient, harmful, not working well, etc. Problem analysers feel some desire to express such components/functions in problem in this Closed-World Diagram, but they are not (yet?) allowed to do so in USIT.
Step 2-2: Construct the Qualitative Change Graph (See Fig. 4)
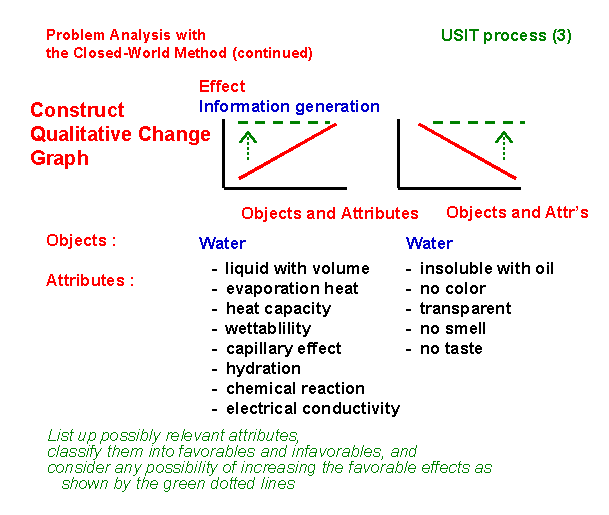
The Qualitative Change Graph is a representation scheme which shows the relationships of the system's target function, or the problematic effect of the current system, with various attributes of system's objects. These relationships are shown in a qualitative way, i.e. quite roughly.
The graph is drawn in a pair as shown
in Fig. 4 using the same ordinates. For the ordinate, either a target
function of the system (i.e. a possitive expression) or a problematic effect
of the current system (i.e. a negative expression) may be taken, as you
like. As the abscissae of the pair of graphs, we should now list
up a variety of attributes of the relevant objects. The left graph
in Fig. 4 represents a positive (or parallel) relationship of the function
of the ordinate with any attribute of the abscissa, while the right graph
shows a negative (or reverse) relationship. Though the relationships
are drawn with straight lines in Fig. 4, they should be interpreted very
roughly. It may just mean that at two points in the abscissa the
ordinate values are different with higher (or lower) values as shown in
the right or left figure.
 |
|
| . |
Fig. 4 Qualitative Change Graphs in the Problem Analysis (OHP drawn in Step 2-2) |
In the present case, the function of information generation is chosen as the ordinate in Fig. 4. Various attributes of the object "water (droplets)" shown in Fig. 3 are now classified in three groups according to their positive/negative/irrelevant relationships with this ordinate function. For example, the attribute "liquid with volume" of water is regarded to have a positive relationship (because the increase in volume makes larger information generation), and is written in the table belonging to the left graph. The attributes "no color" and "transparent" are regarded to have negative relationships (because the increase in the degree of these attributes makes the information more difficult to obtain), and are classified in the right hand table. Those attributes neutral or irrelevant with the ordinate function are not necessary to be shown in Fig. 4. If there are multiple objects in the Closed World, such objects may be arranged horizontally below the graphs and the attributes of each object may be written downward under the object.
The construction of the Qualitative Change Graph is the work for listing up the attributes having relationships with the system's target function (or the system's problematic effect) and for classifying them into positive/negative relationships.
This graph construction urges the
problem analyzer to consider the following points:
(a) For the cases having less
system's target function (such as the left part in the left graph in Fig.
4), is there any means to intensify the target function?
(b) For the cases having larger
problematic effects, is there any means to reduce the problematic effects?
(c) Is there any case where
the change of one attribute for intensifying the target function causes
a change in some other attribute in such a way to prevent/reduce the target
function? -- This corresponds to the case of "Technical Contradiction"
in the TRIZ methodology.
The problem analyzers are stimulated
with these points of thinking and are lead to think of various solution
methods in their conscious/subconscious mind.
Step 2-3: Object-Attribute-Function (OAF) Statements <Skipped>
This step is shown in the USIT flowchart in Fig. 1, but was skipped in the USIT Training Seminar in March.
Note:
According to the USIT textbook written by Dr. Sickafus, this OAF statement
has the following form:
"Attribute Aa of Object
Oa and Attribute Ab of Object Ob support Function F to affect Attribute
Ac of Object Oc."
This statement can be shown in the
scheme:
| . |  |
Object Oc may be the same as Oa or Ob, or may be different from them.
A set of these OAF statements may be constructed into a diagram and can be used for a systematic thinking in the next concept generation stage together with the four solution methods. The diagram seems rather complicated. In the present three-day training seminar, the OAF statements were omitted from the beginning and were not explained at all, probably due to its limitation in time.
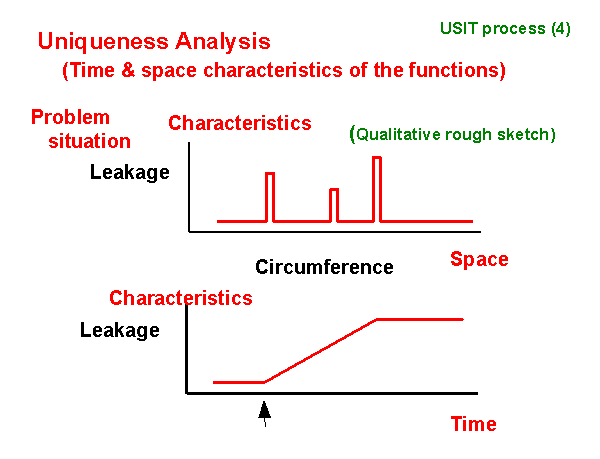
Step2-4: Uniqueness analysis: Space and time characteristics of the functions (See Fig. 5)
In order to realize the problem situation,
two qualitative graphs are drawn in this step. The ordinate of the
graphs represents either the system's target function or the system's problematic
effect. The abscissa in one graph represents some characteristic
of the space, while that in the other graph stands for some characteristic
of the time. In these graphs, one should try to show some characterictic
feature of the system qualitatively, or roughly, instead of quantitatively.
 |
|
| . |
Fig. 5. Uniqueness analysis in the problem analysis phase (OHP drawn in Step 2-4) |
In the present case, the ordinate represent the "leakage", or the information intensity to be detected. In the graph for the space characteristics, the circumference of the valve's inner wall is taken; there may occur small leakages of water from a few places around the circumference. In the time-characteristics graph, on the other hand, the time after applying the pressure during the test is chosen as the abscissa. The graph shows that the total amount of leaked water increases with time and the leakage becomes obvious after some time. It is the target of the present task to find methods to detect the leakage as early as possible (i.e. in small amount of water).
This Uniqueness Analysis intends the analysis of space and time characteristics of the system. It may be regarded as a way of detecting the "Physical Contradiction" in the TRIZ methodology. Once a Physical Contradiction is recognized, the TRIZ methodology can show us a number of standard solutions, such as the separation in space, the separation in time, etc. This is a unique and powerful technique in the TRIZ methodology.
Note: The steps so far are
explained as the steps for Problem Definition and Probelm Analysis.
During these processes of writing statements, constructing diagrams, and
drawing graphs, however, we actually are stimulated very much with various
ideas in our mind and are generating unintendedly a number of seeds of
ideas, which should be processed intendedly in the next stage, i.e. the
Concept Generation stage. If you think of any seed of idea, you should
better take notes of them in/beside the drawings or on memo sheets in order
not to forget and lose them.
4. Stage 3: Concept Generation for Solving the Problems
USIT has four techniques for this stage of problem solving, as shown in the USIT flowchart of Fig. 1. Dr. Sickafus explained them as follows:
(a) Dimensionality Method:
Focuses on the attributes.
To activate/deactivate an
attribute of an object;
To change a constant/fixed
attribute into a variable, and vice versa;
To transform a time-related
attribute into a space-related one, and vice versa.
(b) Pluralization Method:
Focuses on the objects.
To multiply objects, or to
divide objects;
To go to the extremes of
infinity and of null.
(c) Distribution Method:
Focuses on the functions.
To rearrange the functions
(switching, replacing, overlapping, separation, composition, etc.)
(d) Transduction Method:
Focuses on the links of attribute-function-attribute.
To link two functions via
a common attribute, i.e.
Attribute
- Function 1 - Attribute - Function 2 - Attribute.
USIT does not have any strict guideline how to choose these methods and how to proceed. You may apply any method in any order, as you think most suitable. USIT puts a special attention on the Generification of solution concepts, as shown in the USIT flowchart. Once you get an idea as a solution, your should better express it in generalized terms, and try to catch a number of ideas belonging in the same or similar category by associative thinking. USIT advises you to apply the above four methods repeatedly to extend your ideas in a wider and wider concept space. It is important not to limit your ideas by considering (or unconsciously examining) their feasibilities and technical details. Try to make your thinking flexible and to generate new concepts.
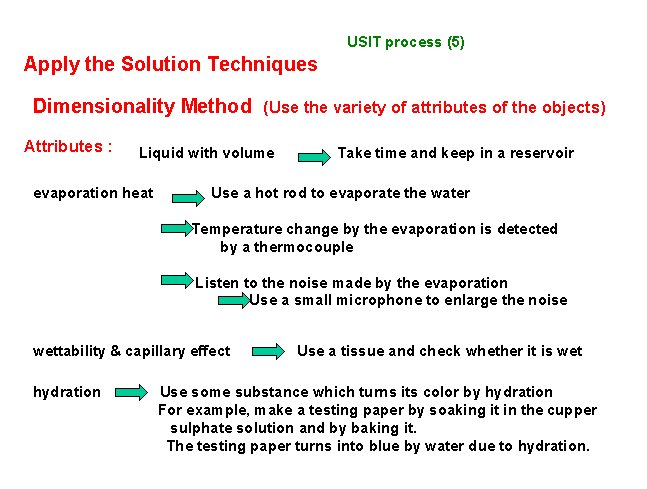
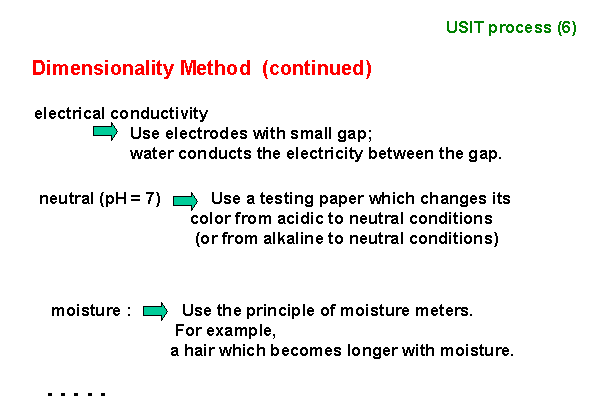
Step 3-1: Concept genration with the dimensionality method
For the present problem of "detecting
small water leakage", or, more properly, the problem of "detection of water",
I chose to apply the Dimesionality Method first becasue it focuses on the
variety of attributes of objects. With reference to the attributes
listed beforehand at the bottom part of the Qualitative Change Graph, we
tried to think of detecting methods for each attribute. The result
we found are described in the two OHP sheets shown in Figs. 6 and 7.
 |
|
| . |
Fig. 6 Concept generation with the Dimensionality Method (OHP sheet drawn in Step 3-1) |
 |
|
| . |
Fig. 7 Concept generation with the Dimensionality Method (OHP sheet drawn in Step 3-1) (continued) |
The application of the Dimensionality Method produced a large number of concepts so easily, to my own surprise. Any attribute, such as the evaporation of water and the neutrality (pH = 7) of water, inspired us to think of some solution ideas, sometimes nice and elegant but some other times seemingly not so effective ones. During this process, it was especially effective to remind of various everyday-life experiences and to form them into solutions for detecting water. I often felt this kind of effectiveness of associative thinking during application of TRIZ to various problems. Some more attributes, e.g. reflection and refraction of light at the water surface, were also discussed in the seminar but are omitted in Figs. 6 and 7.
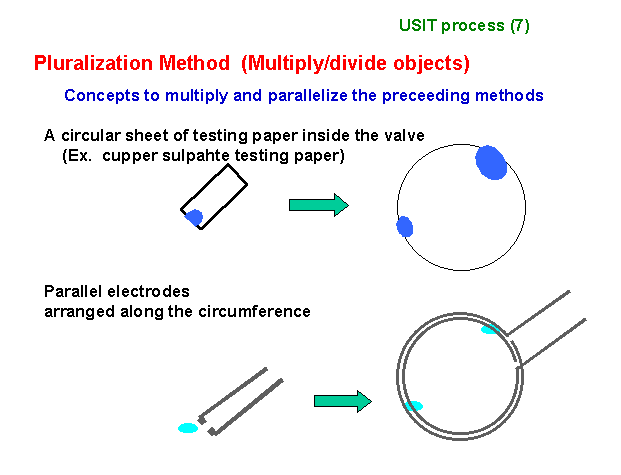
Step 3-2: Concept generation with the Pluralization Method
After obtaining a large number of
concepts quickly with the Dimensionality Method, we next applied the Pluralizaion
Method. The application of this method was much inspired by the understanding
of space characteristics during the Uniqueness Analysis in Step 2-4.
As shown in Fig. 5, the water leakage may occur at any place around
the circumference of the inner wall of the valve gate. It may not
be known beforehand where the leakage occurs. To detect the
water leakage in this situation, it may be a basic strategy to choose any
detection method and try to keep applying it sequencially around the circumference.
In order to make the method more effective, we would like to make the detection
method working at any point of the circumference. This means that
we want to have simultaneous multi-point (or continuous along the circumference)
detection method, rather than one-point detection method. It corresponds
to multiply the detectors and paralellize them. This is exactly the
intention of the Pluralization Method.
 |
|
| . |
Fig. 8. Concept generation with the pluralization method. (OHP sheet drawn during Step 3-2.) |
Figure 8 shows the result of the concepts obtained by the pluralization method. The detection methods using a variety of testing papers, obtained earlier, were readily extended for pluralization and parallelization into the form of circular sheets of testing papers to cover the whole inside area of the valve gate. This extension not only makes the detection effective in parallel, but also easily provides the information of the places and the amounts of the leakages.
At the bottom of Fig. 8, we use two circular electrodes placed along the circumference of the valve gate, so that the electrodes can detect the electrical conduction between the inner and outer electrodes caused by the leaking water droplets at any place of the circumference. As a matter of fact, when I first presented this figure to the seminar members, I was thinking some image of sequencing the detectors (for detecting the leaking place), but one of the members shouted, "Oh, yes! That's a good idea for parallelizing."
4.2 Supplementary comments to the concept generation stage
At the seminar, the concept generation stage finished up to the ideas shown above, because of the time limit. Essential parts of the concept generation, especially building up the framework of the concept generation, were already done well, I think now. I would like to make some remarks for supplementary comments.
(1) Among the concepts obtained
with the Dimensionality Method (shown in Fig. 6), some combine multiple
means. For example:
Evaporation heat
==> Use a hot rod to evaporate the water
==> Listen to the noise made by the evaporation
==> Use a small microphone to enlarge the noise
This combination is actually a sequential
linking of functions; namely, we have applied unconsciously (or as a result
of our ordinary training) the Transduction Method. We were ready
to extend ideas (or technical means) further and further to make them more
effective.
(2) In Fig. 6, I presented an idea of using a testing paper with baked cupper sulphate. This reflected my knowledge that cupper ions are colorless but turn into blue with water in the form of the cupper hydrate ions. This is just an example of stating the ideas in a more concrete form by the use of some technical knowledge. If one does not have such a technical knowledge, one may state, for example, "to use some substance presenting some color after absorbing water". Even though one does not have a concrete idea of such substance, it is a good and important practice to write such a statement. With such statements, practical means can be supplemented afterwards by some other people having technical knowledges.
Furthermore, the use of general terms
in "to use some substance presenting some color after absorbing water"
is an example of the Generification Method and is important to extend concepts
further. By using this general term, we may have a lot of ways to
search for better and useful substances in the same category. We
may also expand the ideas into, say, "to use some substance losing the
color after absorbing water", "to use some substance turns its color after
absorbing water", etc. This way of extension is quite orthodox in
expanding ones ideas. If you think of a keyword, for example, "some
substance making a sound after absorbing water", as an imaginative but
not yet concrete means, you should better write it down even if you may
think it unpractical. As a matter of fact, the "hot rod" in the concepts
obtained in Fig. 6, is an everyday-life example which everybody knows as
"something making a sound when it touches water".
5. Concluding Remarks
In this case study, we have applied the USIT methodology to solve the problem of "Detection of small water leakage from a gate valve", especially by reducing it into the prolem of "Detection of small amount of water (or water droplets)" and by applying the Closed World Method in the parblem analysis stage. We succeeded in generating a rich variety of solution concepts in a short time.
The following elements of USIT techniques
were particularly useful in the present case study:
(1) In the problem definition
stage, the problem was reduced into the one having the minimal set of objects.
(2) By use of the Closed-World
Diagram, a variety of attributes of the object were listed up.
(3) The Dimensionality Method
for the concept generation stage gave a rich variety of viewpoints for
generating solution concepts.
(4) System's space characteristics
analyzed in the Uniqueness Analysis gave a clear guiding principle for
applying the Pluralization Method.
(5) The sequential chain-linking
extension of ideas with the Transduction Method and the parallel expansion
of ideas with the Generification Method effectively served to develop the
solution concepts.
One important lesson I learned during this case study was: "even if we find a good idea, seemingly the best solution, during any intermediate process of problem solving, we should not stick to it and we should not think it the unique, best solution. We should better treat our thinking process more objectively and apply the problem solving steps of USIT (and any other) properly to our own problem solving; thus we should be able to make our own mind more relaxed to generate a variety of solution concepts.
In this sense, "textbook problems" in TRIZ and others are difficult to handle. Once we knew the solution written in the textbook, we often had the predudice that the textbook solution was the correct answer and that we should reach there. This kind of predudice does not allow us to think ideas flexibly. Even the same problem should be reconsidered, because the change/difference in the background may make differnt solution more suitable. In this sense, I think we should try to solve real practical problems seriously by using USIT, TRIZ and any other methodology.
One point I learned during the process
of writing this case study is the hypothesis that the USIT methodology
effectively supports the "breadth-first search" in the problem's solution
space. We may imagine that the solution space is formed in an unknown
tree structure. The trial-and-error method would be wandering near
the end-point regions of the tree structure, jumping from point to point
without any descipline. Many engineers specialized in some field
of technology would be searching in some branch or subtree, i.e. in their
own speciality region, in the "depth-first search method". USIT,
on the other hand, tries to clarify the tree structure of the problem's
solution space, even though partially, and then tries the breadth-first
search on the tree structure found so far. The point I mentioned
here may be just rephrazing the USIT's intention that, in the initial stage
of engineering problem solving, it intends to generate multiple solution
concepts as easily and quickly as possible. This abstract way of
understanding the USIT's strategy is now getting stronger in my mind, I
feel.
Before closing this case study, I
would like to express my sincere thanks to Dr. Ed Sickafus who established
USIT and thoughtfully guided us during the USIT Training Seminar and to
Ravi Chona, my team partner for solving this problem.
| Top of this page | USIT
Seminar
Report (Mar. 99) |
Case Study (2) | Sickafus
paper
(Nov. 98) |
Sickafus
paper
(Mar. 99) |
Japanese
page |
| Home Page | New Information | Introduction to TRIZ | TRIZ References | TRIZ Links |
| TRIZ News & Activities | TRIZ Software Tools | TRIZ Papers and Tech Reports | TRIZ Forum |
Last updated
on Aug. 26, 1999. Access point: Editor: nakagawa@utc.osaka-gu.ac.jp