 TRIZ Paper: Keynote at Japan TRIZ Symposium 2012 (6 years ago) TRIZ Paper: Keynote at Japan TRIZ Symposium 2012 (6 years ago) |


|
How TRIZ can contribute to a paradigm change in R&D practices? |
Denis Cavallucci (INSA Strasbourg, France)
Presented at Japan TRIZ Symposium 2012, held by Japan TRIZ Society, Sept. 6-8, 2012 at Waseda University, Tokyo
|
English page: Keynote Paper, Tutorial Slides
Japanese page: Keynote Paper, Keynote Slides
|
| Posted: Dec. , 2018 |
For going to Japanese pages, press  buttons.
 Editor's Note (Toru Nakagawa, Dec. , 2018)
 Paper (Keynote Lecture)
How TRIZ can contribute to a paradigm change in R&D practices?
Denis Cavallucci (INSA Strasbourg, France)
Keynote Lecture at Japan TRIZ Symposium 2012
Abstract
Tools and methods developed during the era of quality and optimization have shown their limitations and become inappropriate in the context of the requirements of innovation. Nowadays the need to rebuild design practices in enterprises is strongly felt both in terms of human skills and methodological expertise. In part, a way to face the innovation era’s difficulties has been provided through the theory of inventive problem solving. But as TRIZ becomes more popular both in academia and industry, difficulties to obtain the best out of it is strongly felt whether we use its simplified versions or its computerized one. This keynote addresses this difficulty in presenting an original and complete framework, using an industrial example that integrate most of TRIZ fundamentals in a methodology namely Inventive Design Method (IDM).
Table of Contents
1. Introduction
2. From TRIZ to IDM
3. Case example: enamelling of steels
3.1 Methodology and planning for operating IDM process
3.2 Identification of the parameters
3.3 System analysis
3.4 Focus on Multi-screen
3.5 Focus on Evolution laws
3.6 Contradiction synthesis and analysis
3.7 Suggested contradictions: bubble graph
3.8 Suggested contradictions: bubble graph
3.9 Added value of the process: the Solution Concepts
3.10 Estimating the impact of Solution Concepts
3.11 Evaluation results analysis
4. Conclusions and future work
References
1. Introduction
For nearly two decades, TRIZ has appeared as a set of methodological tools useful for supporting inventive aims in industry. This theory represents a significant breakthrough in driving problem statement and solving in a direction that is expressed through the idea that technical systems are driven by objective laws. But the difficulties to fully benefit from TRIZ in companies is strongly felt as TRIZ itself has some incomplete concepts and incoherencies mismatching with current design stages, especially upstream phases. Upstream phases of the design process are often associated with market feedback [1], documentation research [2], a state-of-the-art review [3] and idea generation [4] , followed by a sorting of these ideas to select those to be used in the downstream development phase. A good illustration of this subject is the stage gate process [5], currently quite popular in companies. Yet these approaches provide little assistance, in either the multi-disciplinary formalisation of knowledge [6] required to understand an initial situation that is unsatisfactory or the conception of an innovative system it is intended to improve, or in opening up new knowledge streams to resolve the key issues of this initial situation. We are therefore proposing a new methodological framework known as Inventive Design [7][8] to deal with this issue and with one of its methodological offshoots: the Inventive Design Method (IDM) [9].
The paper is structured as follows: a first section will explain how we derivate from what is called “classical TRIZ” based methodology to IDM through the limitations of TRIZ and the necessity to go beyond these limitations if we want our new method to both benefit from potential and be a method in accordance with today’s industrial problematic in R&D departments [10]. A second section will be dedicated to detail, through a case example, the way IDM is applied using a case study from the steel making industry: enamelling of steels. Then a section is devoted to discuss the content of this research and the limitations of our work so as to summarize its contributions to Inventive Design Methods and Tools. The paper ends with a conclusion and some of our future work in relations to IDM is also presented.
2. From TRIZ to IDM
The IDM method is the fruit of our recent research that uses a structured process upstream of innovation projects [11]. IDM takes the place of the standard or routine design process in the upstream phases and seeks to rapidly arrive at a number of reasonable Solution Concepts to improve a complex initial solution that is unsatisfactory. IDM is part of the so-called "innovation process” in companies. In other terms, IDM is intended to be implemented in a company predisposed to assuming risk after experiencing failed solutions and requiring significant R&D phases to arrive at adequate resolutions. The idea here is not so much that a company state that it operates as an innovation-driven entity—a nearly universal claim made in these times—but rather that it indicate that it is prepared to accept the risk of investigating knowledge that it does not yet fully control.
IDM find its roots into TRIZ methodology. Yet if one can perceived TRIZ as a theory, we are there mainly focused on the methodological aspects of TRIZ and its limitations. In other terms, why TRIZ was not sufficient and for which situations TRIZ was in need of an enhancement based on other theories from different theoretical but complementary background?
TRIZ has been proven to be efficient in simple situations where the problem could almost intuitively be solved. If we read in Altshuller’s book [12][13], the moment in which the inventor appeared, he almost intuitively perceived the right way the initial situation and found on his mastering of inventive tricks and some thinking guidelines (like ideality, ressources, etc…) the solution, very often THE best and only solution.
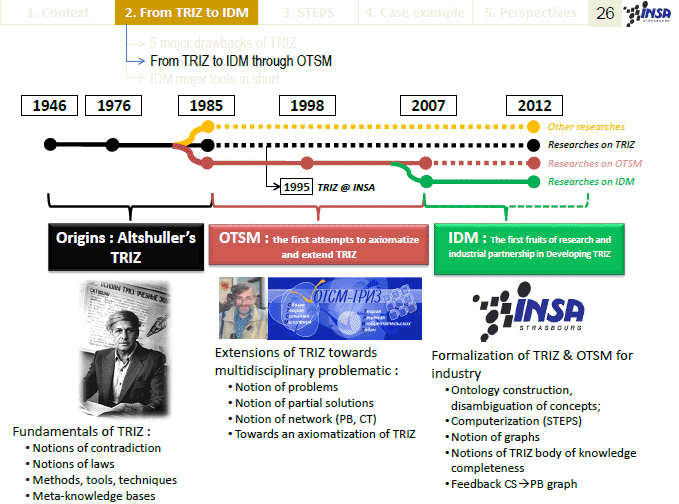
Unfortunately, today’s industrial real life is not as such. Problems that cause problems to engineers are complex problems or difficult problems [14]. Another situation that is encountered by engineers is the fact that on a given situation they rarely discover the first time the problem, they know the problem for years and have had the opportunity to test several time dozens of alternatives extracted from previous brainstorming [15]. Including highly innovative brainstorming, therefore, the major difficulty does not presents itself to engineers like in TRIZ books nowadays. During a first decade of our research investigations, we mostly concentrate our efforts in understanding in which situation TRIZ body of knowledge could not deliver what can be expected out of an ideal method. Then, we found through the work and achievements of N. Khomenko [16][17] some partial answers to these limitations through the framework of OTSM. But not with sufficient accuracy and well defined ontology to be efficiently taught and/or computed. Then we started IDM research framework in our institute in 2007, based on our experiences on both TRIZ and OTSM. The figure 1 is providing a summary of the main components we either built or modified from the two previous works.
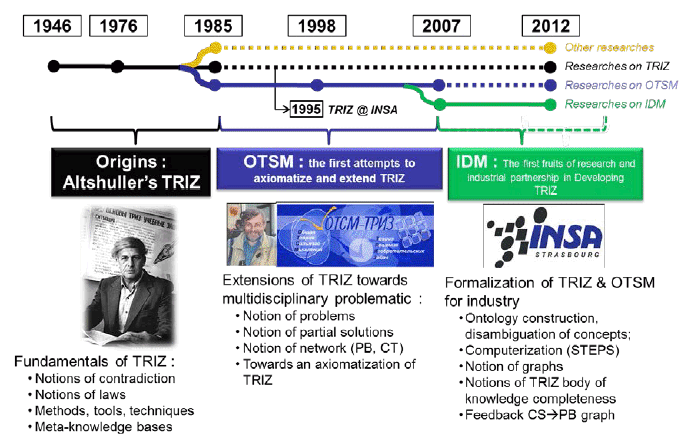
Figure 1: From TRIZ to IDM through OTSM
These limitations are of five orders. Here is a brief explanation of each of them:
-
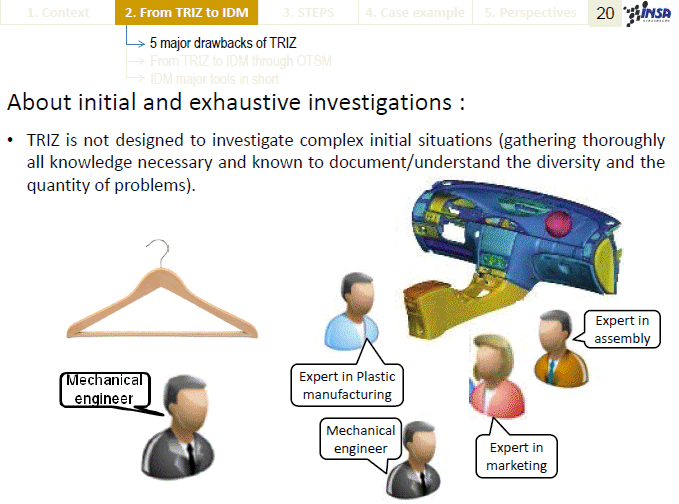
About initial and exhaustive investigations: TRIZ is not designed to investigate initial situations (gathering thoroughly all knowledge necessary and known to qualify the problem)
-
There are no means in TRIZ to efficiently start with a complex initial situation and engineers in R&D departments are rarely confident when the classical TRIZ way of dealing with this task are operating. Often there is a minimum of time allowed to this task and it seems that the TRIZ expert is randomly (or based on intuition) considering the problem at a given systemic level. As a result the level of confidence that the overall problematic has truly been taken into consideration is low. Of course, when a nice solution appear, the level of satisfaction is increased, but the confidence that we really addresses the problem at the right level and right way is not assumed in TRIZ with evidences.
-
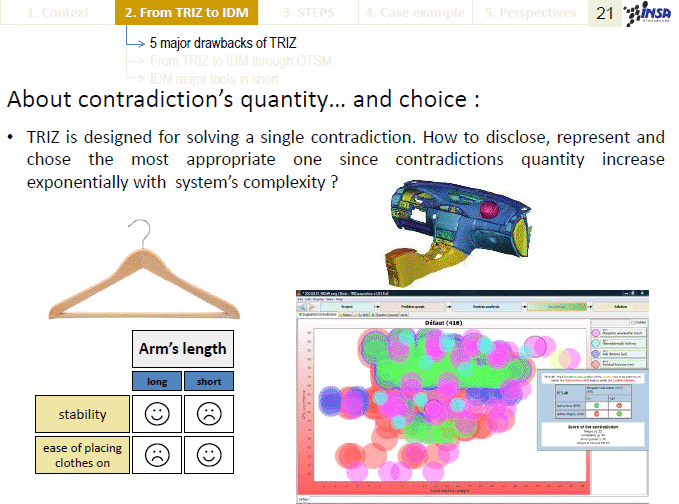
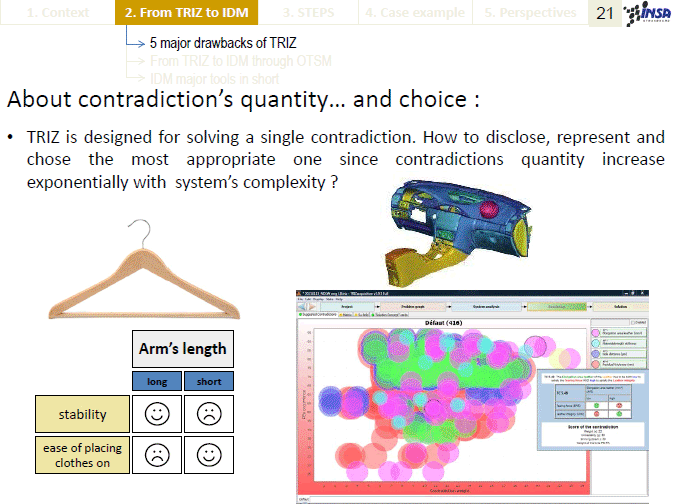
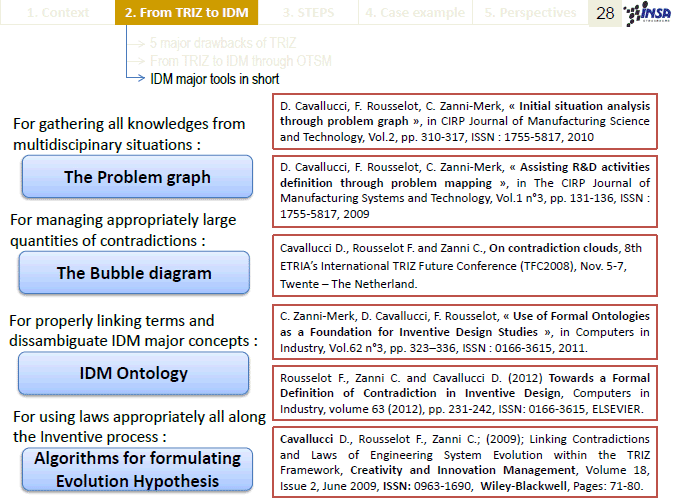
About contradiction’s quantity… and choice: TRIZ is designed for solving a single contradiction. How to choose the most appropriate one since contradictions quantity increase exponentially with any system’s complexity? In real life engineering situations, rarely a problem, even the simplest ones, only shows a set of 3 parameters involved in the problematic. The parameters quantity involved to fully describe all influenced characteristics of a given problem is increasing as the problematic gets complex. Assuming that a set of 3 parameters are already defining a contradiction, how to fully formulate a full set of contradictions related to a problem? We believe that in really complex situations, this set of contradiction can be of several hundred [19]. TRIZ is not proposing anything in such cases. It seems that the contradiction intuitively sticks-out of the inventor’s mind among a set of potentially involved other parameters. Then how can we ensure that the one disclosed is the one we should solve in priority?
-
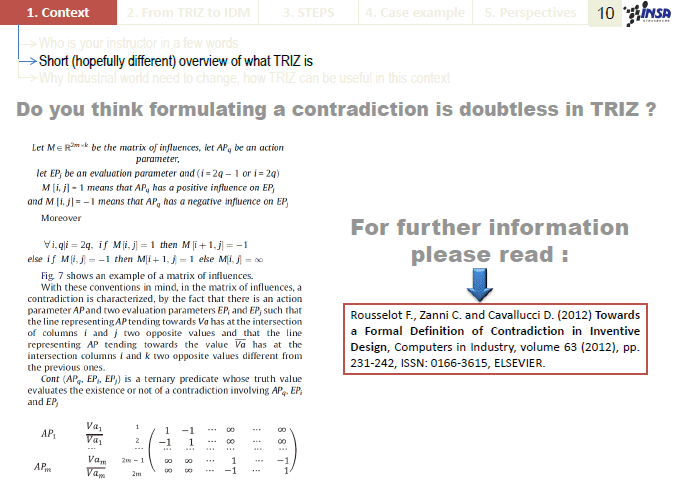
About a methodology to disclose a contradiction: There are no accurate ways to disclose appropriately a contradiction. The definition of a contradiction (at different levels of formulation) is given in almost all TRIZ books. But these descriptions are rather simple and it seems obvious in simple situations. Only OTSM framework made an interesting proposal to separate parameters typology in two kinds (control and evaluating)[17]. We believe that if a contradiction is not defined up to its physical level, then the level of definition is improperly defined [20]. As a consequence, we shall not consider technical contradictions (with no physical oppositions) as “true” contradictions but only as “prototypes” of contradiction.
-
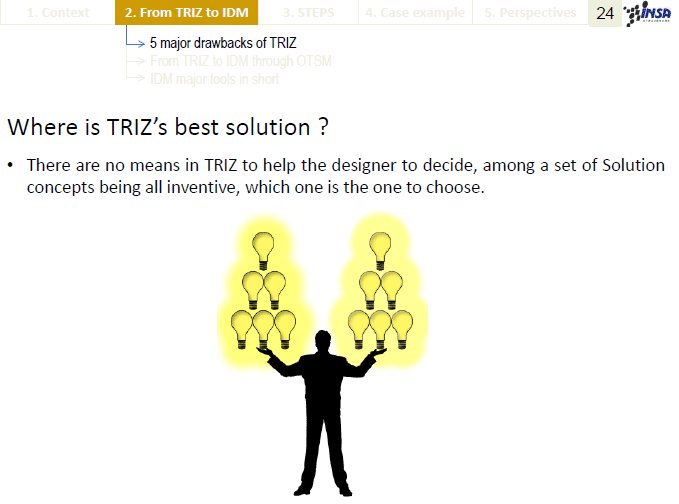
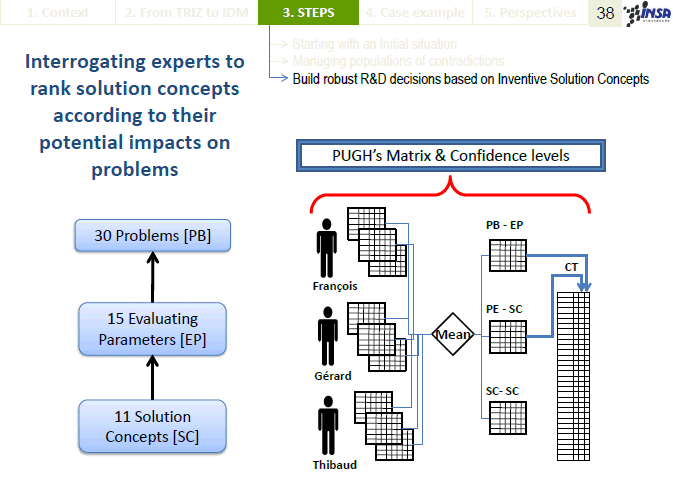
Solution Concepts that emerge from TRIZ technique usage are often inventive (since TRIZ refuses compromise). Therefore, as creativity of people led by TRIZ techniques is efficiently put into practice, the quantity of solutions might exceed a single one. In our past experience of using TRIZ, in most cases, the population of solutions was between 5 and 20. Now how to choose among several solutions the best one that addresses, not only a single contradiction, but a set of contradiction behind a set of problems? In classical TRIZ, only intuition is leading to the choice of a solution, then how can we be convinced that among a set of solutions there is no necessity to further find an additional one? To be confident with such a choice, we believe there must be mathematical means, based on statistical expert’s votes on potential influences. Such an approach leads us not only to highlight the solution concept, but also to rank all solutions ordered by their capacity to solve sub-sets of contradictions disclosed in the overall problematic [21].
-
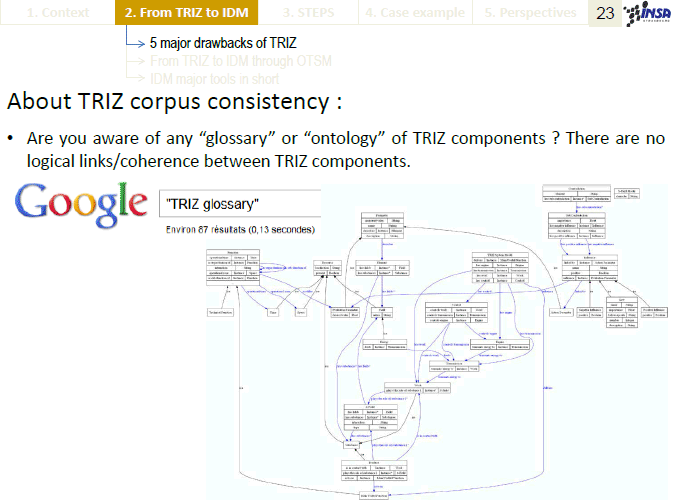
About TRIZ corpus (or body of knowledge) consistency: We are not aware of any “glossary” related to TRIZ. Therefore, there are no logical links/coherence between TRIZ components as each TRIZ component appears at a given level of abstraction, being more or less categorized or related to another term, but a completed description of all TRIZ components with their definition and inter-relations does not exist. This is what is commonly called in Artificial Intelligence an ontology. Such ontology work starts to appear within several publications [22][23][24] but is only a proposal of a team, here we need a commonly agreed work on TRIZ ontology from all the TRIZ community to go further with scientific tools to investigate its potential and make it progress.
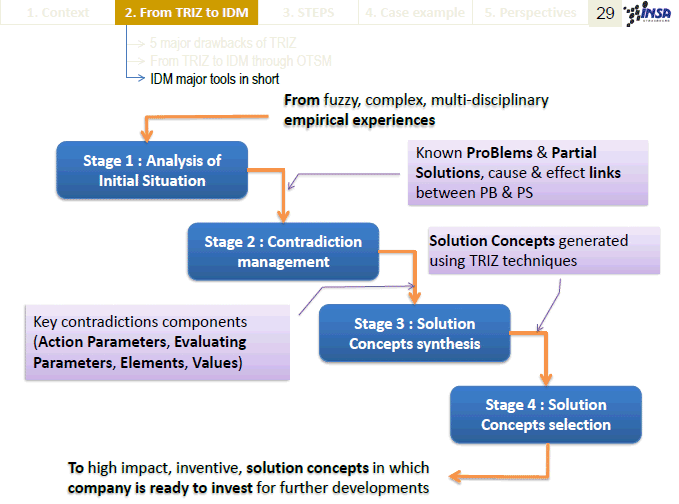
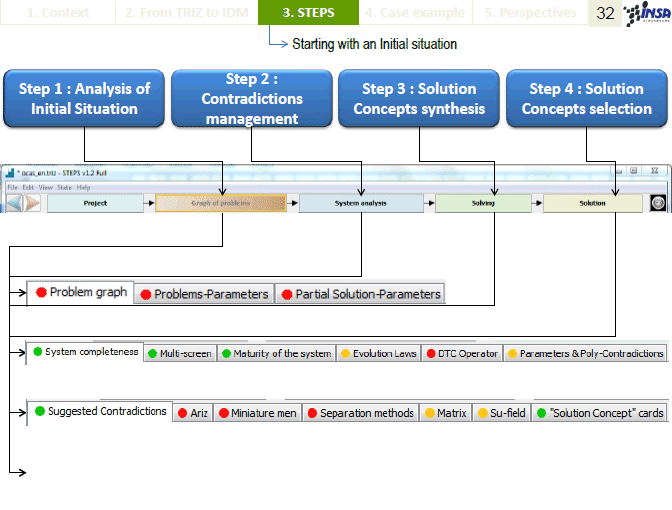
To summarize, these five limitations were at the basis of the challenges behind IDM framework of research. It has been conducted by both scientists from different fields (Artificial Intelligence, Computer science, Engineering science, Social and Educational science) during the past 5 years. IDM breaks down into four stages as shown in the diagram below:
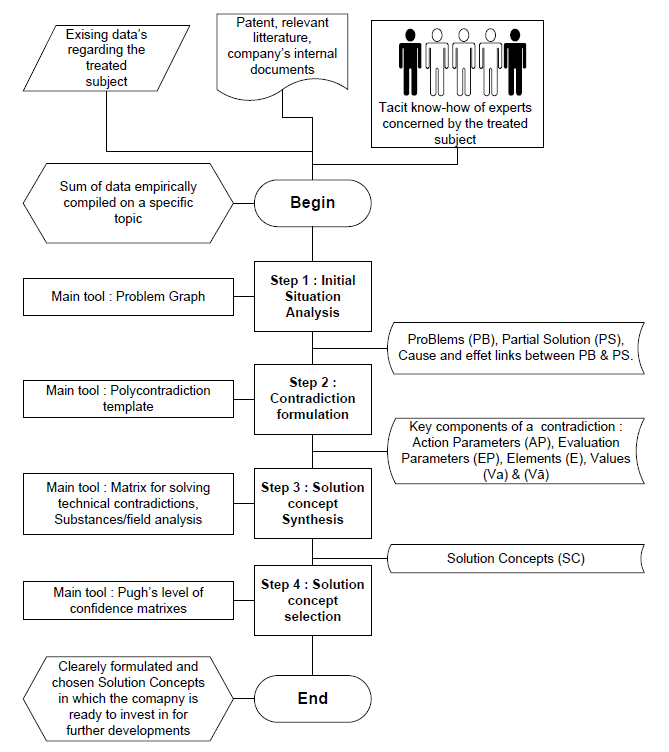
Figure 2: Macrostructure of the IDM concept
Step 1: Initial situation analysis: This phase consists of investigating all knowledge having to do with the initial unsatisfactory situation and transposing this tacit and explicit knowledge [5], which may exist either in textual documents or in the minds of experts, into an exploitable mathematical model in order to determine by which means to enter into a more detailed or parameterised description of the problem. The objective here is to build a "problems graph" resulting from this transposition in order to develop from a situation that is fuzzy, often resulting from an empirical heaping of studies experiences, toward an exploitable graphic model that uses rules and algorithms of the Graph theory [6]. The problems graph is made up of elements of a simple symbolic graph, which rapidly facilitates clarification and recording of tacit knowledge bits gleaned from questioning. It is proposing a graphic model in which two knowledge categories coexist: knowledge representing problems as yet unresolved from the initial situation and knowledge representing known partial solutions in the same domain.
Step 2: Formulating contradictions: With Stage 1 decision making conventions in place, what appears as a key issue in the study is subsequently used as a departure point for producing a detailed formalisation of a range of polycontradictions, from which the contradictions of the area being examined will be extracted and put in order. These contradictions are the technical and physical issues to resolve in order to have an impact on root problems that render the initial situation unsatisfactory. The following phases are found within this stage:
- Formulating polycontradictions
- Extracting contradictions
- Creating a priority-based hierarchy of each contradiction depending on a given scenario
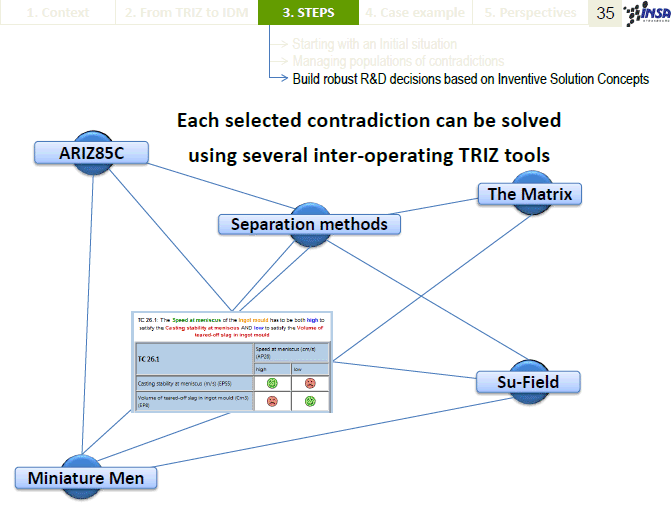
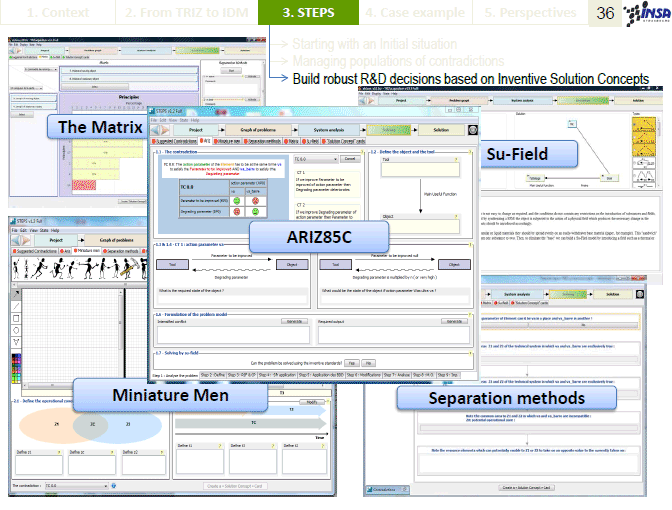
Step 3: Generation of Solutions Concepts: Each contradiction stated as a priority in the previous stage then becomes an entry point for implementing TRIZ techniques and tools to achieve a resolution without trade-offs. The problem resolution processes are used for each of the priority contradictions and may be successive or iterative. They exploit the technical contradictions resolution matrix related to inventive principles, the Substances-Field modelling related to the Inventive Standards system and the ARIZ-85C algorithm. This stage produces a limited number of solution concepts that are pertinent to the initial situation and exhibit full traceability.
Step 4: Selection of solution concepts: In this stage, the hypothetical impact of each solution concept is weighed against the problems graph created in Stage 1. The purpose of this is to evaluate the impact of each of the solution concepts on the initial unsatisfactory situation and to choose which one or ones among them to develop more in detail. These stages were detailed in a previous publication [25].
The closest set of procedure, methods and tools to IDM is, as said in introduction, is OTSM. Nevertheless, even if we found many advanced definitions in OTSM that were appropriately moving in the right direction, we could not clearly define a coherent corpus of components useful for fully operating OTSM both in education and research. In table 1, we summarize the major components of OTSM and how have they been either replaced or reconstructed in order to fit with the overall ontology of IDM.
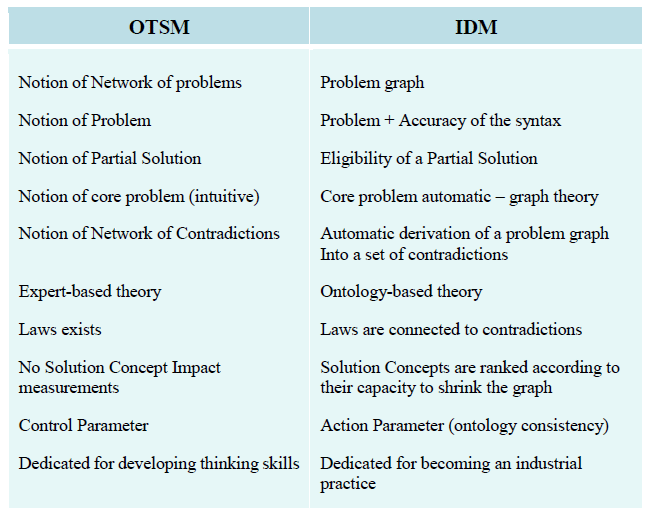
Table 1: OTSM and IDM major differences
3. Case example: enamelling of steels
During the last five years, enamelled steel and ceramic or glass coatings came out as potential way aiming at finding new solutions for different applications in Appliance, Construction and even Metal Processing. When a problematic such as long term corrosion protection, temperature resistance, abrasion, chemical resistance, recyclability, sustainability, long term durability, clean ability, were discussed, porcelain enamels were found to show several interesting properties regarding the requirements [26]. Enamelling is a niche, a very specific coating process today known only by a few specialists. It is defined as a “post-treatment”, that is to say, it is engaged as a final stage, after forming and welding by end customers.
Obviously, a pre-enamelled steel – understood as steel coated by a glass layer – could not be the solution as this association is based on two antagonist products: steel is formable, light, robust and used mostly for these properties, while enamel (glass) is brittle and cannot be deformed. Key actors on the scene of steels (steelmakers) propose a precursor of the final vitrified coating, a metal sheet coated with one or more formable layers, precursors of the final coating.
A porcelain enamel coating is thick: this property is not a must. This characteristic is the result of two facts. First, until now, enamel is applied after forming on complex shapes, operation that leads to a wide dispersion. Second, the link between steel and enamel obtained at high temperature is a rather thick interface of about 40µm. This interface needs to be fully covered, as it does not have the required properties.
Our industrial partner already tried in the past to introduce enamels in powder form in a “precursor” of the final vitrified layer. It was impossible to reduce thicknesses of the layers. This project, known internally as “pre-enamelled steel” was patented and closed. Even if the main substrate used today is Cold Rolled Steel, enamel is also applied on other metals & alloys such as aluminium, copper, stainless steel, cast iron, NiAl....
That is why it was decided to launch IDM methodology on enamelling in order to identify trends, priorities and maybe proposals of further action plans. As shortly mentioned earlier, the main driving forces for this breakthrough are:
1. from thick to thin ceramic (glass) coating technologies and products;
2. from post- to pre-treatment to keep on knowledge and added value;
3. working on steel or multi-metal systems;
4. allowing also for the evolution of the processes (forming, firing, welding, coating...) as compared to the state of the art.
3.1 Methodology and planning for operating IDM process
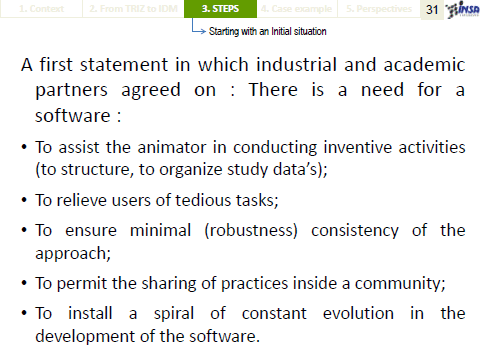
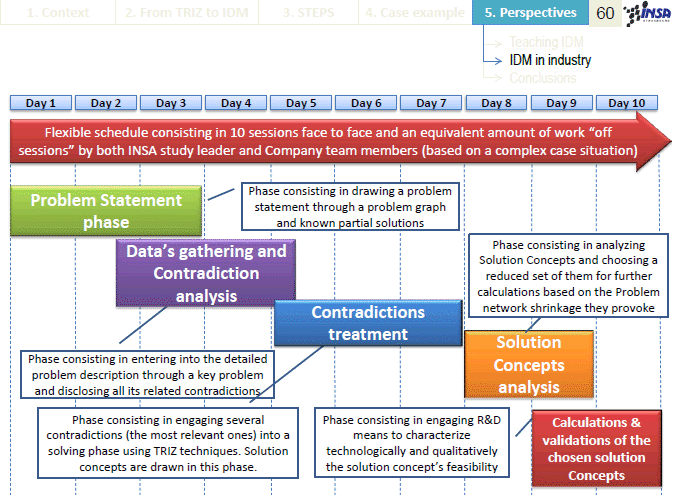
Based on IDM and TRIZ, a software tool namely STEPS (Systematic Tool for Efficient Problem Solving) was built. Its structure totally matches IDM process as illustrated figure 2. Typically, to go through the software steps, 10 sessions are necessary according to the planning pictured on Figure 3.
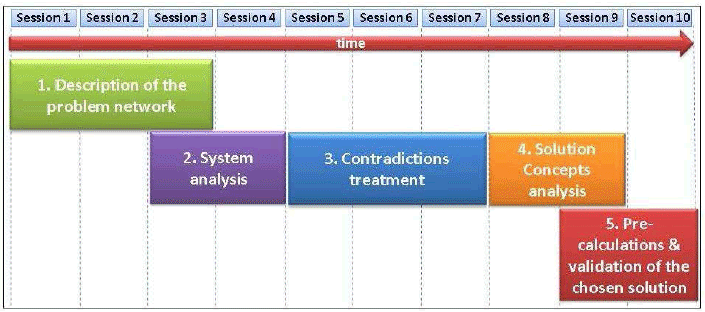
Figure 3: Timeline of a classical IDM process
Each session corresponding to one working day, Figure 3 gives an idea of the time dedicated to each step. Consecutive sessions can be separated by a few weeks during which the study can be carried on internally; this is especially advised for the 3 sessions making up the 1st step, because it allows for further maturation of the network. This step consists in identifying first the main, central problem of the study, then its origins, then their origins, etc. The process goes on and on in order to build a graph. The description also includes, when there are any, the partial solutions known in the art to the problems thus identified. For instance, in the case of enamelling, the starting point was the fact that enamelled products are expensive. The reasons for this were found to be:
- Steel for enamelling, itself, is expensive
- The enamelling process is complex and not continuous
- The enamelling process involves high temperatures (energy cost)
- The enamel layer is oversized (product cost)
This part of the study required the contribution of 6 people from diverse and complementary backgrounds.
- a specialist in ceramics and enamelling (formulations, processes, properties, applications)
- a specialist in metallurgy (chemistry, treatments and processes, properties, applications)
- a scientist with a large scientific knowledge in materials and processes and in Intellectual Property issues
- an engineer having knowledge in metallurgy (processes, products, customers approach) and project pilot for enamelling steel since around 1995
- a scientist having scientific knowledge in materials, particularly in ceramics
- an animator, expert in IDM, STEPS and particularly in TRIZ
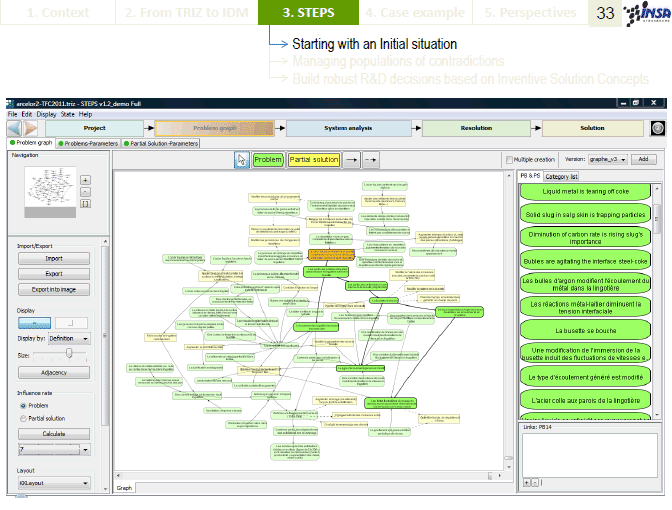
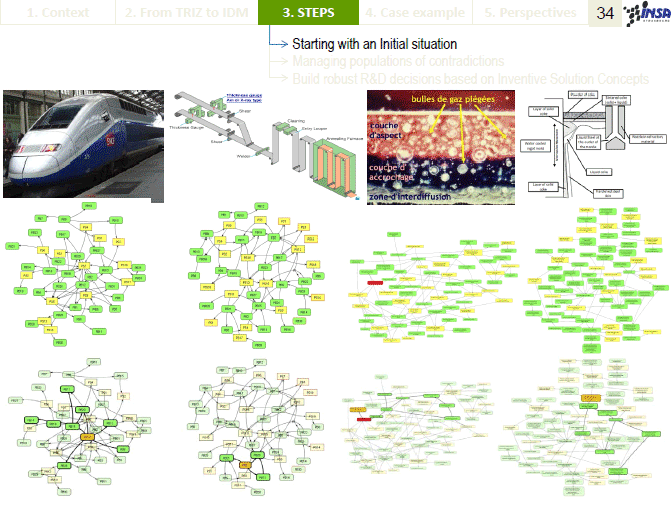
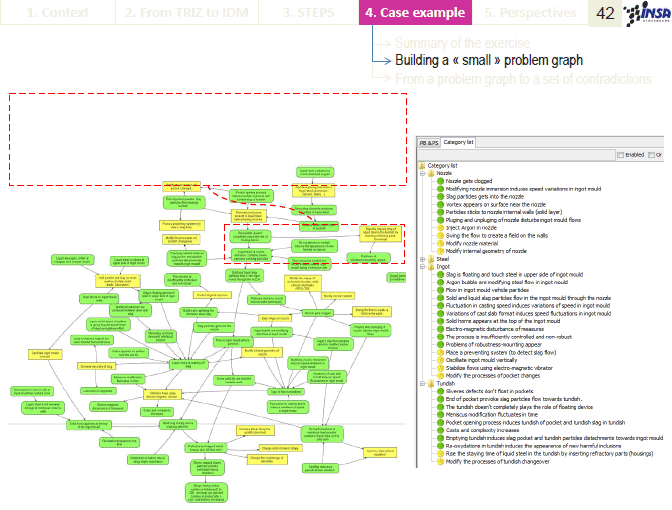
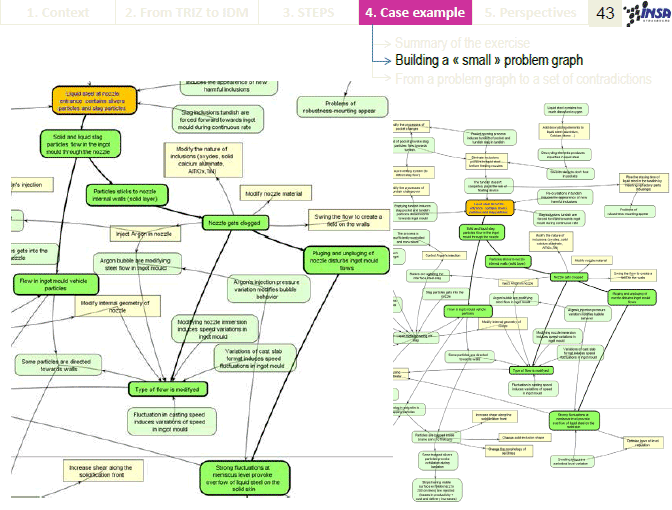
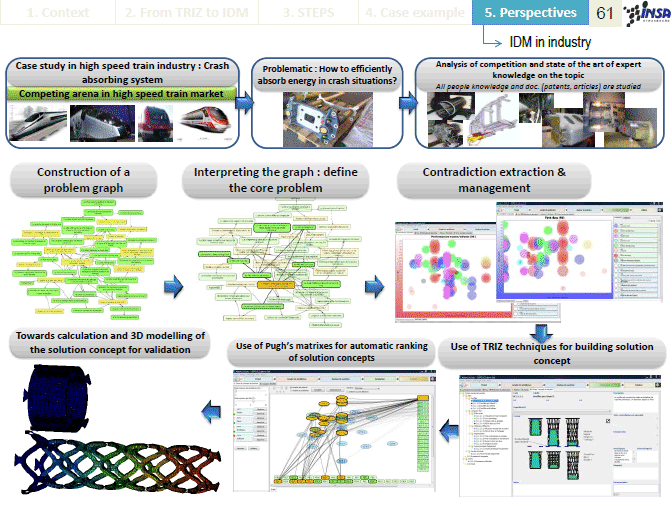
The resulting network is represented by a graph, made up of green and yellow boxes (see figure 4). The green boxes correspond to the problems and the yellow ones to the partial solutions. These can be processes already used in industry or ideas found in articles or patents, but they must have been experienced and found to – at least partly – succeed in solving the given problem. However they often give rise, in turn, to new problems: this is why they are called “partial solutions”. As a consequence, a yellow box can never be found at the end of a sequence, but is always followed by a green one, otherwise it would mean that the global solution has been found. Figure 4 displays the problem graph after roughly 25 hours of work, they emphasize how complex a problem can get, with 44 problems (green boxes) and 25 partial solutions (yellow boxes). Important is to note that, once completed, the network not only constitutes the essential basis for the rest of the exercise, but also provides a schematic representation of the state-of-the-art which:
- must be agreed by all the participants
- can be re-used
- can be added, in the future, with new findings
As such, the network of problems has been considered as a very interesting starting point for new projects by the team members.
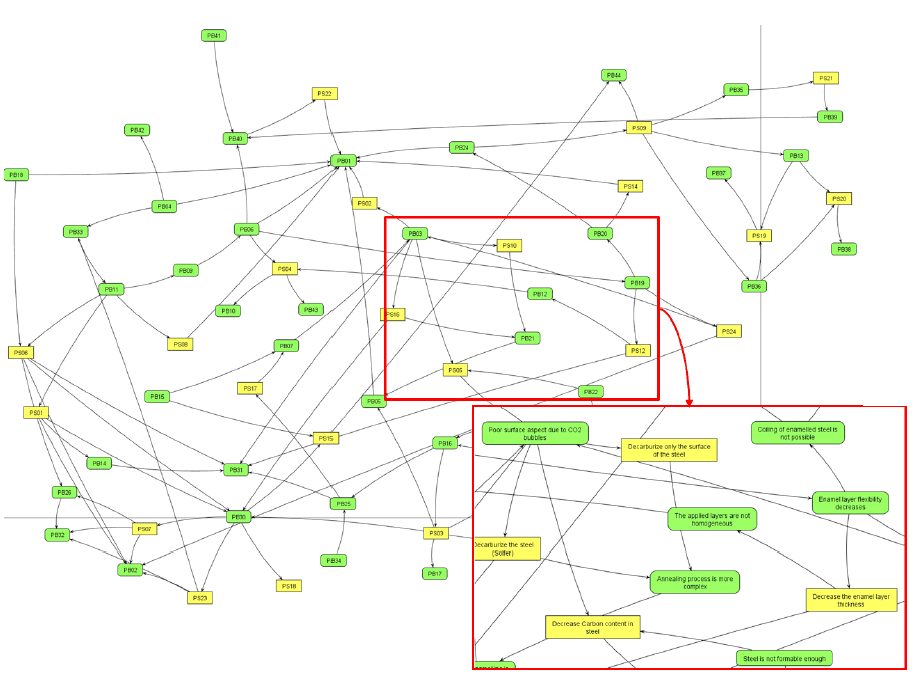
Figure 4: Overall vision of a Problem Graph associated to enamelling problem
3.2 Identification of the parameters
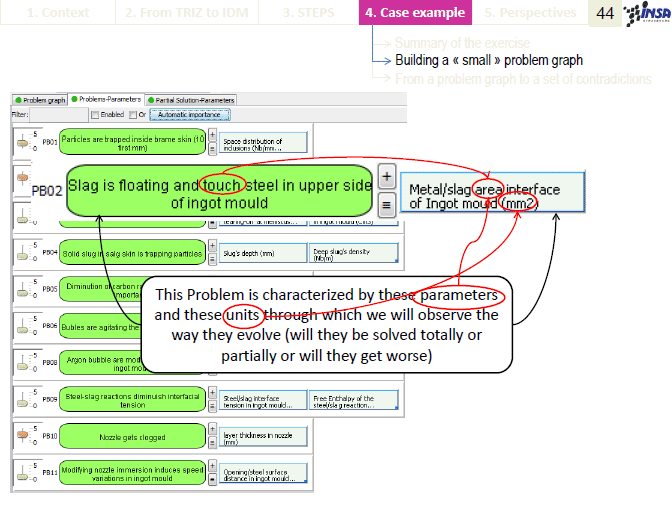
Each problem or partial solutions is then associated to one or several parameter(s), linked to a unit. The problems are also granted a weight according to their importance in the whole network, from 0 (not very important) to 5 (critical). These parameters allow qualifying, qualitatively or quantitatively, the evolution of the problems (PB), like a kind of “tracer”. For a given problem, the associated parameter(s) can be identified by asking the question: “which parameter(s) can be used as a tracer for this problem?” In some cases the answer is obvious: for example, the problem “Enamelled steel is expensive” can be followed by the parameter “Total cost” expressed in €/m2. Sometimes it is not so patent: the problem “Hydrogen-traps concentration (cementite) decreases” has to be evaluated by measuring the permeation time, given in min. The list of the parameters that were associated to the problems can be found in Table 3 in the annexes.
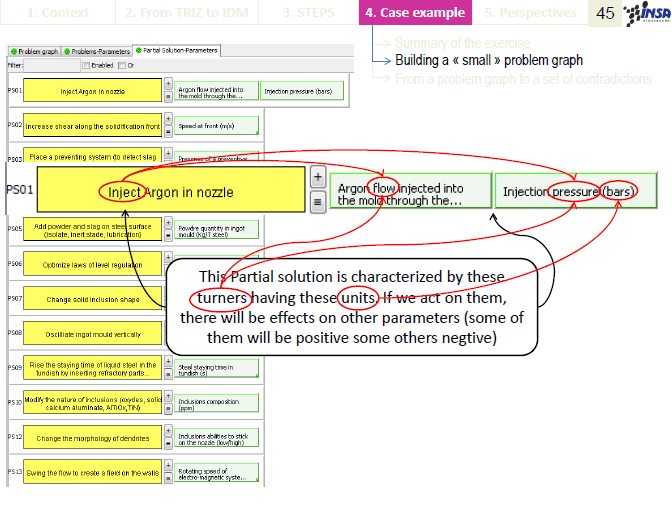
The parameter(s) derived from each Partial Solution (PS) can be identified by asking the question: ”which parameter(s) of the system was (were) worked on to operate this solution?” Let’s take the example of the PS “Increase the roughness” to the PB “Adhesion decreases” acts on the parameter “roughness” measured in µm. Once identified, the parameters are sorted into 2 categories: Evaluation Parameters (EP) and Action Parameters (AP).
EPs are parameters whose evolution is only wished in one direction; there is absolutely no interest to see it move in the other one. For example, the problem “Enamelled steel is expensive” was characterized by the parameter “Total cost” expressed in €/m2: this parameter is not desired to increase, but only to decrease. EPs can also be described as parameters that we cannot directly control but are subjected to. Once defined, they have to be granted a weight, called “importance” that represents how critical it is.
To the contrary of the case of EPs, the evolution of Action Parameters (APs) is interesting in both directions. They can be seen as a tuner on which it is possible to act. Alike EPs, they are given a coefficient representative of the level of influence.
Most of the time, the parameters associated to problems and to partial solutions are EPs and APs, respectively, but they have to be studied individually to confirm this distribution. Besides, in some cases several problems can be associated to a single parameter; and the other way around: one single problem may be followed by several parameters. This is why the numbers of EPs and APs do not have to equal those of problems and partial solutions, respectively; for instance in our case, 36 EPs and 20 APs were identified.
At this point of the study the problem is already extensively developed. However to achieve a complete description, further examinations are required. This is the purpose of the next step.
3.3 System analysis
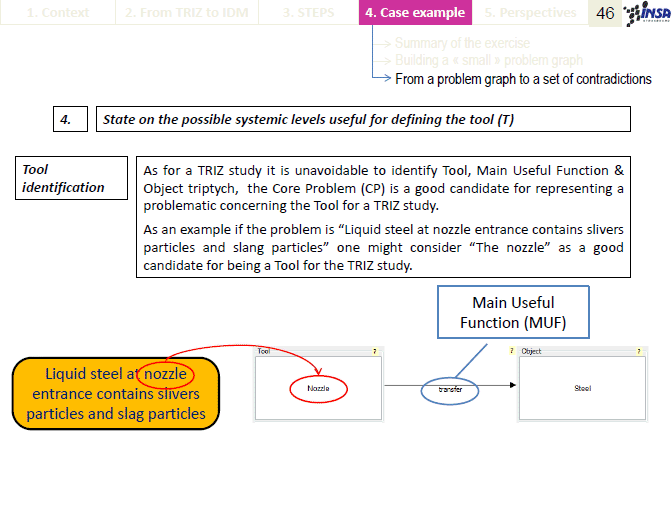
Towards a complete description of the problem in link with the basics of TRIZ, STEPS software enables us to fully define the system’s structure, contradictions and hypothesis of evolution. To achieve all these steps, series of tools coming from TRIZ and often re-arranged and enhanced are proposed:
- system completeness
- multi-screen
- system maturity
- evolution laws
- DTC operators
The goal is to approach the problem from points of view that are not usually considered.
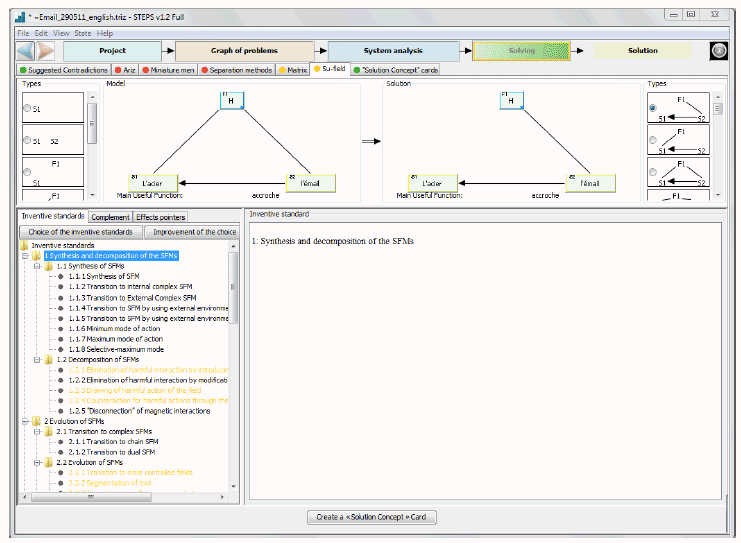
Figure 5: STEPS software interface – solving tools window (Su-Field option)
3.4 Focus on Multi-screen
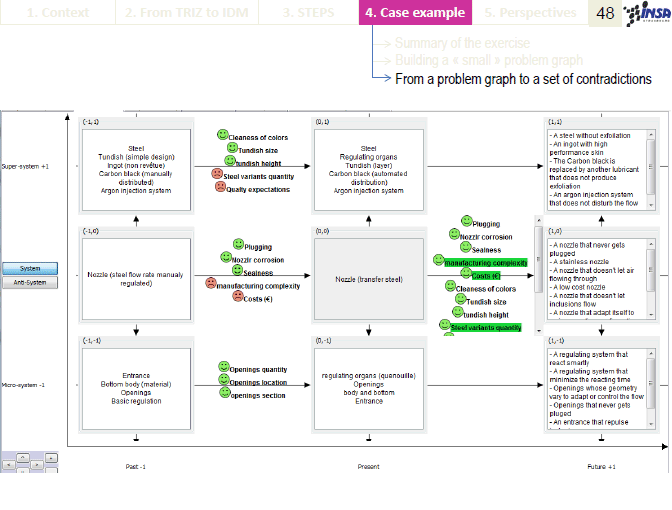
Also known as “9 windows”, this tool represents the system:
- In a temporal environment (“x axis”): the “-1” (on the left hand-side), “0” (in the middle) and “+1” windows (on the right) correspond to the past, present and future, respectively;
- In a systemic environment (“y axis”): the studied system (middle windows) belongs to a larger one, called “super-system” (top windows), and includes a smaller one, called “micro-system” (bottom windows);
In the present case, the super-system consists of the steel, the enamel, the thermal treatment and the application process, while the micro-system is made of the chemical elements Fe, C and O, the iron
oxides, the inter-metallic layer, the bonding oxides (referred to as “catalysts” on Figure 5) and the
roughness of the steel. It will be noticed that the super-system includes the tool and the object of the system (as defined in 3.2.1.1); as for the micro-system, it is made of some of the parts of the tool (engine, transmission, controls). The purpose of these 9 windows is to describe how the studied system and its super- and micro-systems have been evolving in time. By translating this evolution into parameters that have been either improved or damaged, it can allow for the identification of other parameters than those derived from the problems and partial solutions of the problem graph. Looking at the past is also the opportunity to search for the last technical jump that revolutionized the studied field. In our case, it was pointed out that generalisation of pickling and nickeling in the 80’s induced a major change in enamelling; indeed the nickel thus brought to the surface of the steel highly promoted the enamel adhesion.
3.5 Focus on Evolution laws
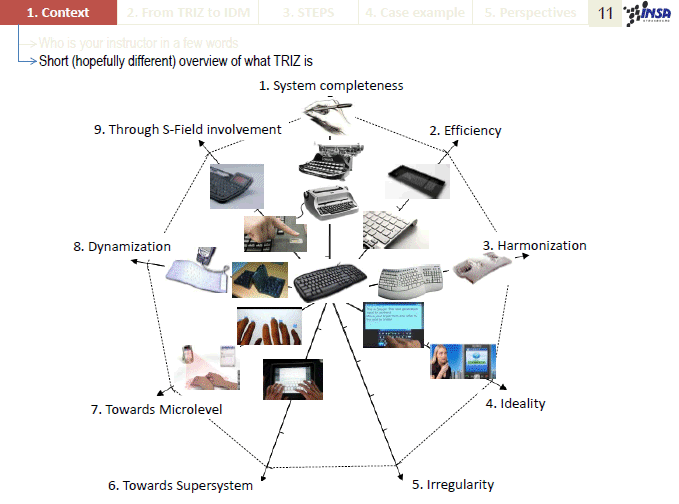
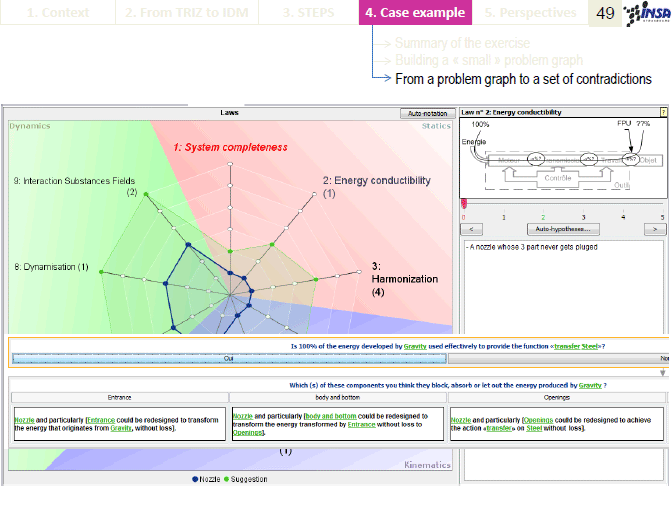
This tool presents the 9 evolution laws defined in TRIZ methodology, i.e.:
1) System completeness: any technical system is made of several well defined parts properly connected to each other, at least one of them has to be controllable to make possible the control of the whole system;
2) Energy conductibility: none of the constitutive parts of the system must slow down the energy flow that makes it work;
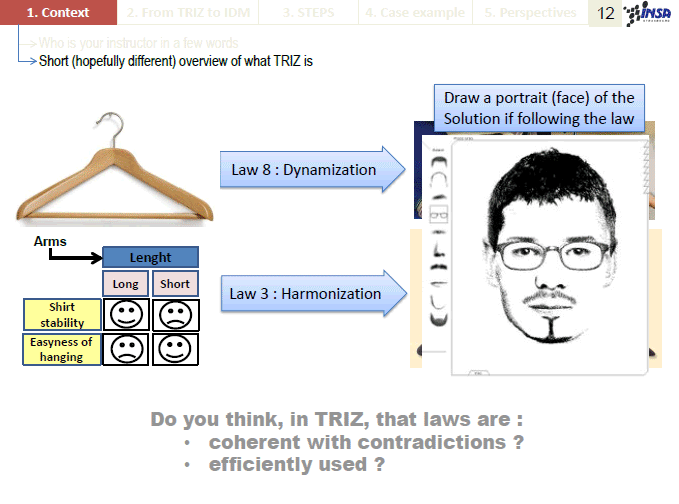
3) Harmonization: tendency of a system to make all its constitutive elements evolve homogeneously;
4) Ideality: tendency of a system to have all its desired and un-desired properties maximised and minimized, respectively;
5) Irregular evolution of the parts: tendency of a system to solve contradictions resulting from an heterogeneous evolution of its different parts;
6) Super-system transition: tendency of a system to disappear as such to the benefit of the super-system it belongs to;
7) Micro-level transition: tendency of a system to see its element “work” evolve towards the micro-level;
8) Dynamisation: tendency of a system to have a flexible structure, able to quickly change and adapt;
9) Interaction substances-fields: tendency of a system to see new connexions appear within its structure, increasing the ways to control it;
It will be noticed that the laws “system completeness”, “super-system transition” and “micro-level transition” are extensively exploited in the first two points of the system analysis. For each of the 9 laws, the software gives the question to ask in order to determine whether the law is relevant in the present case or not; if it is, it suggests how to modify the system to make it conform to the given law. To illustrate this part of the study, let’s take the example of the 5th law, dealing with the evolution of the different parts of the system. Here the question asked is: “are all the system’s components at the optimum of their development for maximizing the main useful function or not?”; if the answer is positive (all parts optimized), this law can be passed over, otherwise it is suggested to imagine how to fix this particular component’s problem to unlock the evolution of the whole system. This is what was done, giving rise to a situation where the adhesion mechanism would be of a different kind, e.g. velcro-mechanical, thus requiring no redox reaction anymore. These laws can eventually help to define the evolution desired for the system and its super- and micro-systems, to go on fulfilling the right-side windows of the multi-screen. This examination enables to bring new elements to the problem network; it is only once the system analysis has been completed that the problem graph is considered as definitive.
3.6 Contradiction synthesis and analysis
When the problem has been properly settled, lots of contradictions appear. Indeed, some parameters are wished to evolve in different directions depending on the cases. One of the strongest points of TRIZ methodology consists in taking into account all these contradictions to analyse them using computing calculation, a task that would not be feasible in a reasonable time by hand. To allow for this automatic analysis, all the contradictions arising from the confrontation between the parameters have to be listed. To do so, the APs are first classified according to the element of the system they refer to. Then, each EP is successively placed in front of all the APs to determine whether the latter can impact the former. There is a contradiction as soon as a given AP positively influences different EPs when it evolves in opposite directions. For example, the Action Parameter “Firing time” can be either long or short:
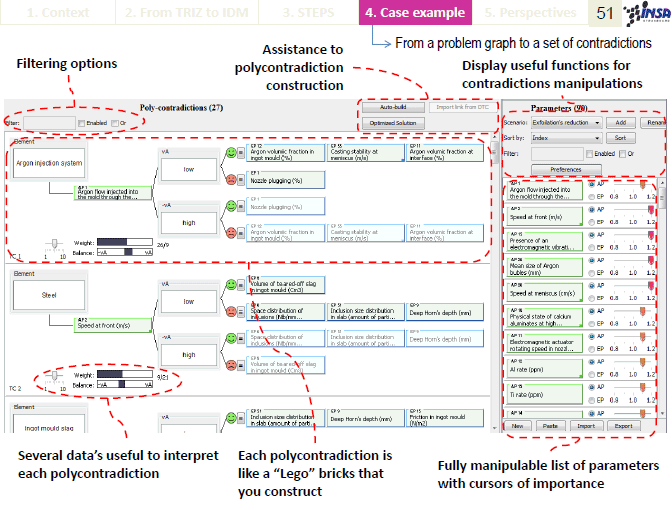
The contradictions are gathered into groups called poly-contradictions, according to the AP they correspond to; as a result, there are as many poly-contradictions as APs (here, 20). A poly- contradiction is thus defined by a set of data:
- an Action Parameter (in the example above: “Firing time”)
- the element it refers to (Enamel)
- the 2 opposite values it can take (“long” and “short”)
- the list of the Evaluation Parameters impacted (“Reactive layer thickness”, “Total cost”, “Enamelled sheet bending”, “Enamel adhesion” and “Surface quality of the enamel”)
This “confrontation operation” applied to every EPs and APs resulted in our case in a total of 127 contradictions. To each poly-contradiction the software associates a weight, calculated from the importance of the EPs and the coefficient of the AP involved, as well as a balance between the two possible values of the AP.
3.7 Suggested contradictions: bubble graph
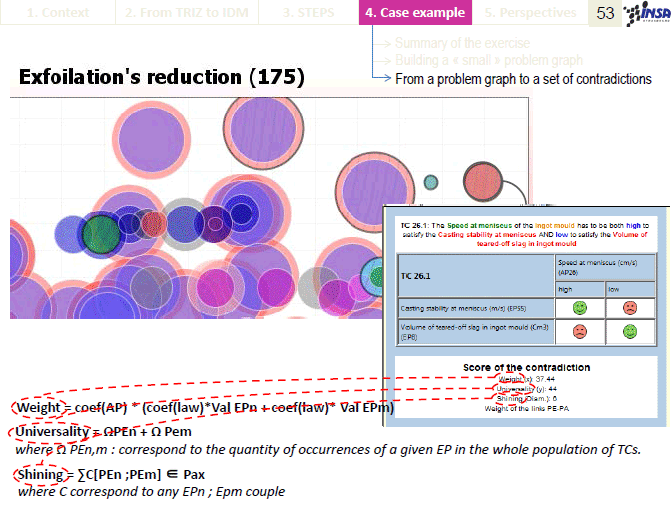
STEPS software splits the poly-contradictions into “mono” contradictions. Contrary to the poly- contradictions, the contradictions only involve two Evaluation Parameters from those of the poly- contradictions, impacted by the same Action Parameter but in opposite ways. For example, in the poly-contradiction mentioned above, one value of the AP impacts three EPs positively and two EPs negatively, so it is split into six contradictions.
Each contradiction is characterized by:
- its weight,
- its universality i.e. the number of other contradictions involving the same EPs,
- the shining of its AP i.e. the number of EPs it impacts
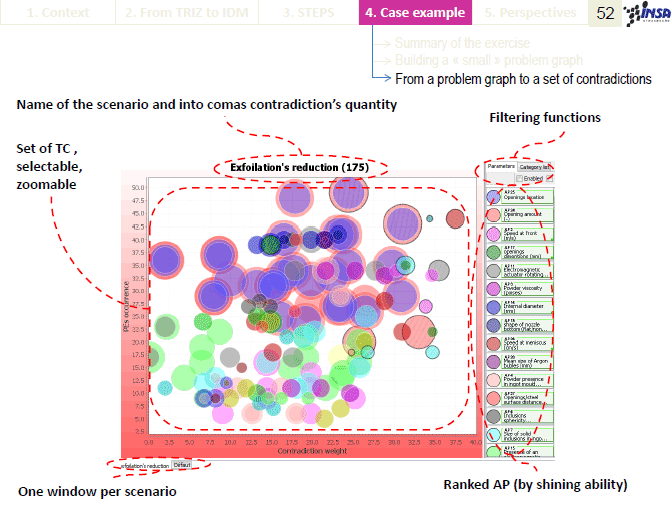
The contradictions are then represented on a graph (Figure 6) where the three properties appear through the position and the aspect of the bubbles: each one corresponds to a contradiction, whose weight is plotted on the x-axis, the universality on the y-axis while the size of the bubble figure the shining of the Action Parameter. The contradictions represented by the same colour stem from the same poly-contradiction; they thus share the same AP and as a consequence they have the same size; however they can be bigger or smaller to make it possible to distinguish superposed bubbles from each other.
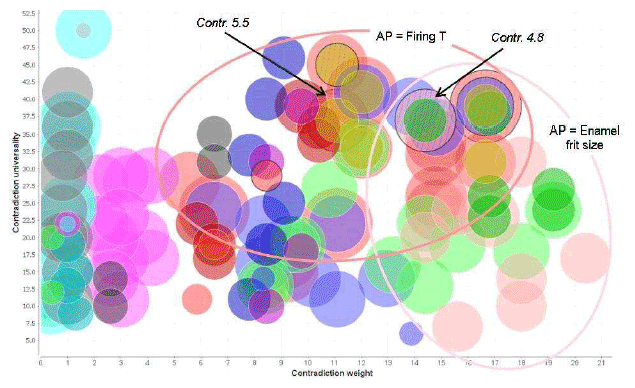
Figure 6: Bubble graph diagram of all gathered contradictions and scoring
The purpose of such a diagram (figure 6) is to suggest the contradictions that are the most relevant to start with: the ones with the highest weight, universality and shining. Practically speaking, the contradictions represented by the biggest bubbles near the top right-hand corner shall be treated first. Furthermore it is advised to work on different Action Parameters (i.e. different colours) related to different elements. In our case we focused on the two contradictions pointed out by the arrows on Figure 6, although both Action Parameters (“Firing Temperature” and “Average particle size of the enamel frit”) relate to the element “Enamel”.
The contradictions can also be individually expressed with a sentence and represented by a table that sums up all its properties. It has to be pointed out that these sentences are set up automatically, with a fixed structure, and that such an automatic generation is only allowed by the strict syntax imposed by the method. Figure 7 shows this representation for the two contradictions we particularly focused on (pointed at by arrows on the bubble graph of Figure 6).
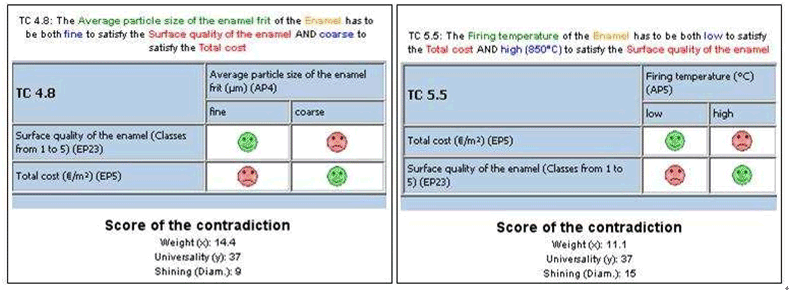
Figure 7: Contradiction n°4.8 and 5.5 represented as tables
3.8 Resolution of the contradictions
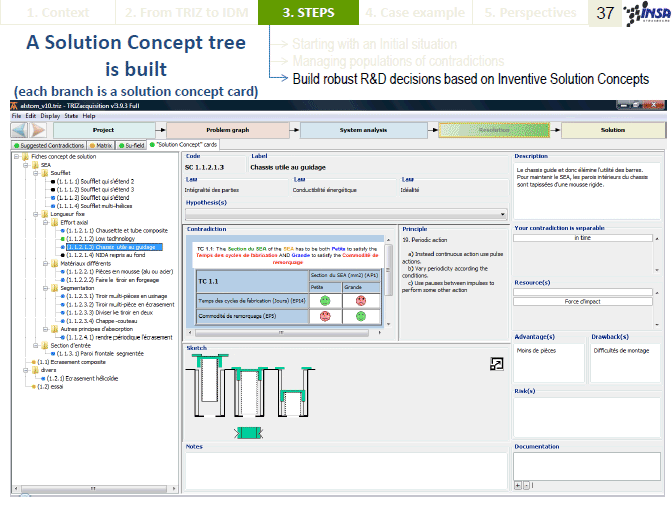
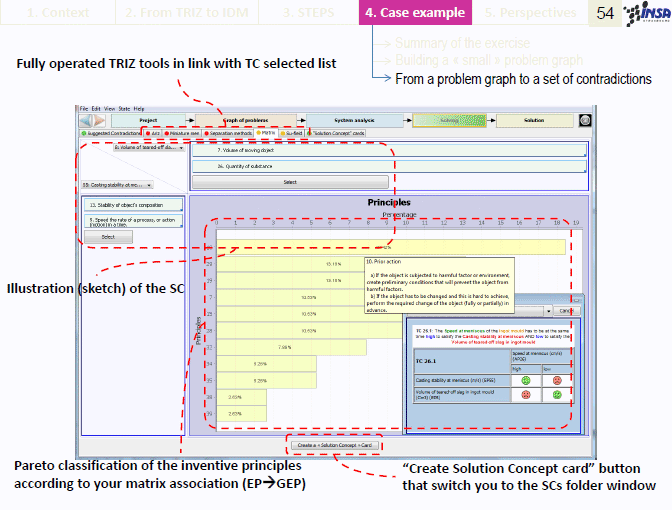
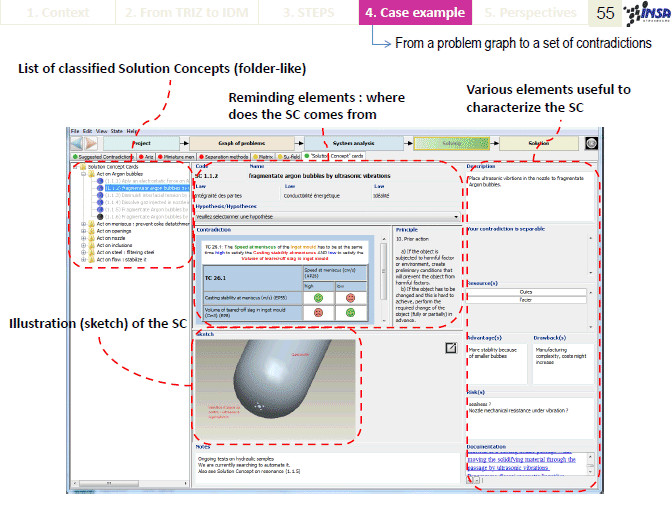
This is where the creative work actually starts. To boost this creation process, and thus to solve the selected contradictions, different enhanced TRIZ tools are proposed to address these contradictions (like matrix or Substances-field). The generated ideas are called “Solution Concepts” (SCs). The Solution Concepts are described in files called “cards” that have to be as detailed as possible. For this purpose, the software enables to draw schemes and to attach documents such as bibliographic references. The advantages and drawbacks can be listed as well as the risks implied by each solution.
Our creative work gave rise to a total of 24 Solution Concepts (SC). They were classified into 5 categories, depending on whether they are related to the interface steel / enamel, to the steel itself, to the enamel itself, to the enamelling process, or to the use of a composite coating. 24 SCs being quite a lot as compared to the average, a first screening was performed, to rule out the concepts that seemed the least convincing but taking care to keep at least one from each category. We ended up with 17 SCs that represent the value created by the whole exercise.
3.9 Added value of the process: the Solution Concepts
Due to the high confidentiality of the case study, it is not possible to enter into detailed explanation of solution concepts. They were externally evaluated to extract the most promising ones. The measures taken to investigate the latter are also given in the next section. The SCs have been classified into four categories:
- Solution Concepts related to the interface
- Solution Concepts related to the steel
- Solution Concepts related to the enamel
- Solution Concepts related to the enamelling process
3.10 Estimating the impact of Solution Concepts
First, the links between the Evaluation Parameters and the problems are weighed. The weight is positive if the problem tends to be solved when the EP evolves towards the desired direction, and negative in the opposite case. The absolute value ranges from 1 to 3 according to the strength of the link. For example, the problem “the enamel layer is oversized” is greatly solved when the parameter “reactive layer thickness” moves towards lower values; the weight of the link is thus: +3. This part is done internally and results in the “EP-PB matrix”. Then the relation between Evaluation Parameters and Solution Concepts is established, i.e. the impact each SC can have on each EP, must be weighed. To be objective, this evaluation cannot be done by those who have generated the concepts: this is why external experts are called for. Practically speaking, the analysis consists in filling out an evaluation grid. The weight is positive if the Solution Concept is believed to be able to make the Evaluation Parameter evolve in the desired direction, and reversely; and here again, the absolute value reflects how strong the impact (positive or negative) is expected to be. Each expert’s evaluation results in a “EP-SC matrix”.
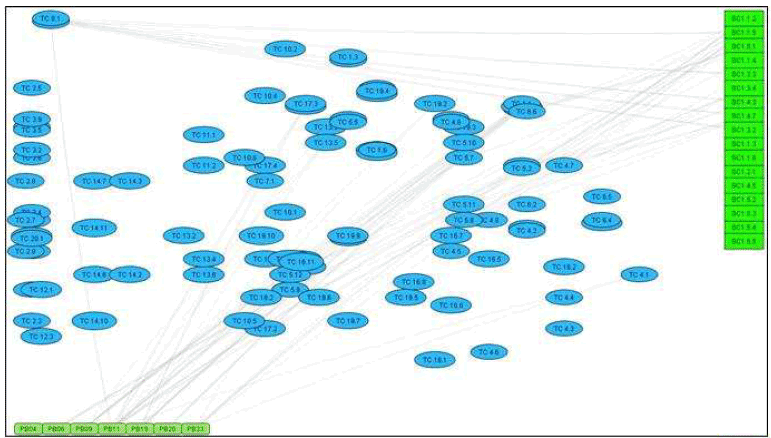
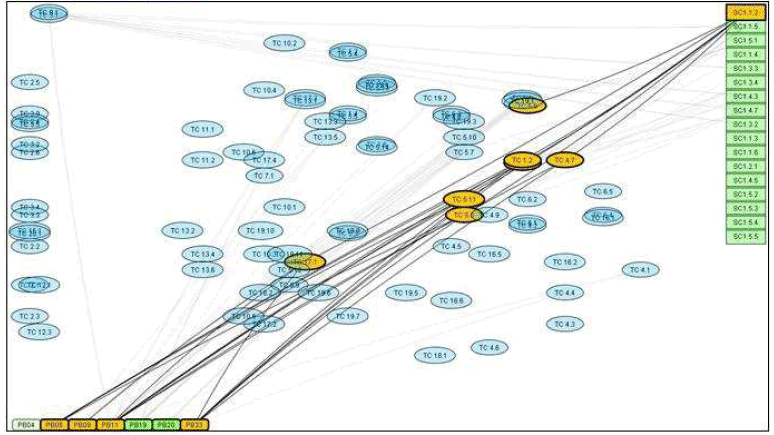
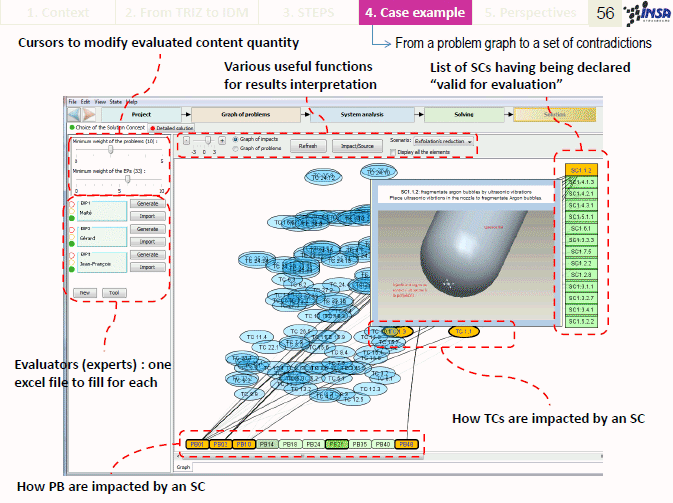
Figure 8: Links between re-ordered SCs and PBs
3.11 Evaluation results analysis
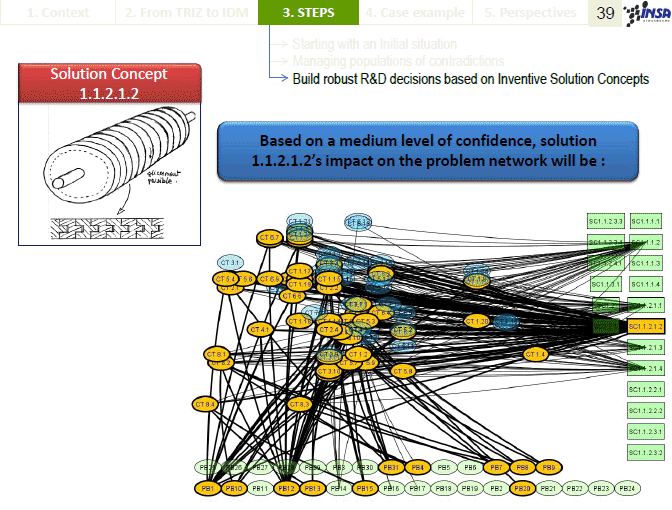
The “EP-PB” and “EP-SC” matrixes are entered in the software and matrix calculations are processed to generate a global “PB-SC” matrix that reflects the expected impact of the Solution Concepts on the problems, taking into account the contributions of all the evaluators. The program returns a graph as the one shown on Figure 8 (top). Note that the purpose of this figure is only to show how the results returned by the program are represented; the text itself does not bring much, since everything will be detailed in the next paragraphs.
The 17 Solution Concepts evaluated are represented by the green boxes on the right-hand side, and the problems by those at the bottom. The blue ellipses figure the contradictions lifted when the SCs are processed, leading to the solving of the problems. It will be noticed that only 7 problems appeared at the bottom of the graph, whereas many more were identified at the beginning of the study: indeed, in order to make this graph more readable, it is possible to select the minimum weight of the problems to be displayed. The same goes for the Evaluation Parameters: depending on the chosen minimum weight, the number of contradictions (blue ellipses) will be changed.
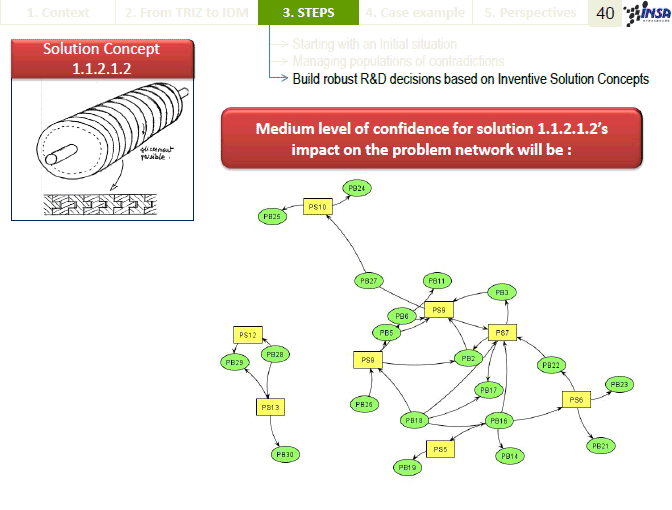
It is also possible to check how many problems are solved by each SC, as shown on the graph of Figure 8 (bottom): those directly solved are highlighted in orange, and the sub-problems they resulted in (which are also solved in a domino effect) are highlighted in green.
The Solution Concepts are classified by decreased number of solved problems. Given that the results can dramatically change if the opinion of one expert highly differs from the other ones, simulations were made, successively ruling out one expert at a time. The number of Solution Concepts able to solve problems was found to vary (from 10 to 6) as well as their ordering. However, whatever the combination of 4 experts taken into account, 2 SCs always appeared among the first 3 ones: SC n°1.1.5 and SC n°1.1.2. These SCs are currently in experimentation phase and provided to the industrial partner, reliable and robust R&D programs with high impact on an initial problematic that, at first, was not showing any relevant direction on where to search and place R&D efforts.
4. Conclusions and future work
Through this article, we intended to present our recent achievements in terms of applied research based on both TRIZ and OTSM framework. We first introduced how we appreciate some of the methods and tools of TRIZ, how we have evaluated their limitations. IDM research framework was constituted upon the willingness of large scale companies to cope with TRIZ limitations in 2006. After six years of investigation, analysis and case studies, we can now propose a complete framework in support to inventive projects aiming at provoking innovation in R&D departments. Upon these research results, it has been possible to build a useful software to support the deployment of IDM and speed-up the process without losing the accuracy of the methodology, namely STEPS. In order for IDM to be comprehensive and transferable to industry, we beforehand had to build a complete ontology of its major concepts, so as to publish on its major tools to explain other researchers and industrialists our beliefs and their roots together with examples.
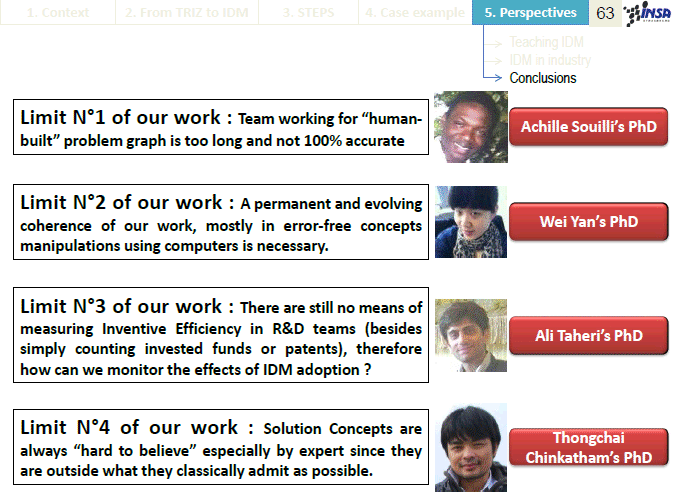
Our upcoming work follows 3 directions: The first one is to establish appropriate measurement means (indicators) of inventive practices in R&D in order to scientifically prove the added value of practicing IDM when in innovation contexts. The second is to investigate the possible links between inventive Design and routine Design tasks like calculation (or optimization) in order to be more confident with the Solution Concept true robustness and thus financial investments in developing them. The third one is going in the direction of patent mining as we believe invention can be provoke due to the smart use of available knowledge (as distant as possible from the original field). In this direction, patent represents more than 80% of engineering knowledge available but definitely underused in context of inventive design.
Today, we are thankful to the Japan TRIZ society to allow us to publicly present the result of this research, hoping that it will serve TRIZ world and become for all of its members, researchers, industrialists, educators, newcomers, a way to efficiently put Inventive Design into practice and as a result boost innovative strategies of companies turned towards a reliable future.
References
[1] A. Johne, « Listening to the Voice of the Market », International Marketing Review, vol. 11, no. 1, p. 47–59, 1994.
[2] M. Hertzum et A. M. Pejtersen, « The information-seeking practices of engineers: searching for documents as well as for people », Information Processing & Management, vol. 36, no. 5, p. 761–778, 2000.
[3] I. Nonaka, R. Toyama, et N. Konno, « SECI, Ba and Leadership: a Unified Model of Dynamic Knowledge Creation », Long Range Planning, vol. 33, no. 1, p. 5-34, févr. 2000.
[4] P. Anglei, « Thinking out of the box: a new approach to product development : Business Horizons 38 (3), 18-22 (May-June 1995) », Long Range Planning, vol. 28, no. 5, p. 129, oct. 1995.
[5] B. J. Järrehult,, « The end of the funnel », vol. 9, no. 1, p. 4-16, 2009.
[6] C. Eastman, D. S. Parker, et T.-S. Jeng, « Managing the Integrety of Design Data Generated by Multiple Applications: The Theory and Practice of Patching », Research in Engineering Design, vol. 9, no. 3, p. 125-145, 1997.
[7] M. Barak, « Promoting inventive design and problem-solving competencies », in 2008 Proceedings of the 9th Biennial Conference on Engineering Systems Design and Analysis, Haifa, 2009, vol. 3, p. 587-593.
[8] D. Cavallucci, « Structuring knowledge use in inventive design », IFIP International Federation for Information Processing, vol. 250, p. 231-242, 2007.
[9] D. Cavallucci, F. Rousselot, et C. Zanni, « Assisting R&D activities definition through problem mapping », CIRP Journal of Manufacturing Science and Technology, vol. 1, no. 3, p. 131-136, 2009.
[10]D. Cavallucci, « From TRIZ to OTSM-TRIZ: Addressing complexity challenges in inventive design », International Journal of Product Development, vol. 4, no. 1-2, p. 4-21, 2007.
[11] M. Dodgson et S. Hinze, « Indicators used to measure the innovation process: defects and possible remedies », Research Evaluation, vol. 9, p. 101-114, août 2000.
[12] G. Altshuller, Creativity as an exact science: the theory of the solution of inventive problems. Gordon and Breach Science Publishers, 1984.
[13] G. S. Altshuller, AND SUDDENLY THE INVENTOR APPEARED: TRIZ, the Theory of Inventive Problem Solving. Worchester: Massachusetts: Technical Innovation Center, 1996.
[14] R. A. Baldwin et M. J. Chung, « Managing Engineering Data for Complex Products », Research in Engineering Design, vol. 7, no. 4, p. 215–231, 1995.
[15] W. Stroebe, B. A. Nijstad, et E. F. Rietzschel, « Beyond Productivity Loss in Brainstorming Groups: The Evolution of a Question », vol. Volume 43, Academic Press, 2010, p. 157-203.
[16] N. Khomenko, R. De Guio, L. Lelait, et I. Kaikov, « A framework for OTSM-TRIZ-based computer support to be used in complex problem management », International Journal of Computer Applications in Technology, vol. 30, no. 1-2, p. 88-104, 2007.
[17] N. Khomenko et R. De Guio, « OTSM Network of Problems for representing and analysing problem situations with computer support », in TRENDS IN COMPUTER AIDED INNOVATION, 2007, vol. 250, p. 77-88.
[18] G. Colombo et D. Pugliese, « The role of knowledge management in product lifecycle », in Innovation in Life Cycle Engineering and Sustainable Development, 2006, p. 397-406.
[19] D. Cavallucci, F. Rousselot, et C. Zanni, « Representing and selecting problems through contradictions clouds », in COMPUTER-AIDED INNOVATION (CAI), 2008, vol. 277, p. 43-56.
[20] F. Rousselot, C. Zanni-Merk, et D. Cavallucci, « Towards a formal definition of contradiction in inventive design », Computers in Industry, vol. 63, no. 3, p. 231-242, avr. 2012.
[21] H. Mizuyama et K. Ishida, « Systematic Decision Making Process for Identifying the Contradictions to be Tackled by TRIZ to Accomplish Product Innovation », JAMRIS, vol. 1, no. 4, p. 21-29, 2007.
[22] A. a Bultey, « A substance-field ontology to support the TRIZ thinking approach », International Journal of Computer Applications in Technology, vol. 30, no. 1-2, p. 113-124, 2007.
[23] P. Prickett et I. Aparicio, « The development of a modified TRIZ Technical System ontology », Computers in Industry, vol. 63, no. 3, p. 252-264, avr. 2012.
[24] D. Cavallucci, F. Rousselot, et C. Zanni, « An ontology for TRIZ », Procedia Engineering, vol. 9, no. 0, p. 251-260, 2011.
[25] C. Zanni-Merk, « An ontological basis for computer aided innovation », Computers in Industry, vol. 60, no. 8, p. 563-574, 2009.
[26] E. Millon, J. F. Brice, R. Gerardin, O. Evrard, L. Guillot, P. Seurin, et M. Entringer, « L’émail: un solvant basique et réducteur à l’état fondu », L’ Industrie céramique, no. 824, p. 113-117.
 Presentation Slides PDF
  (66 Slides, 7.5 MB)
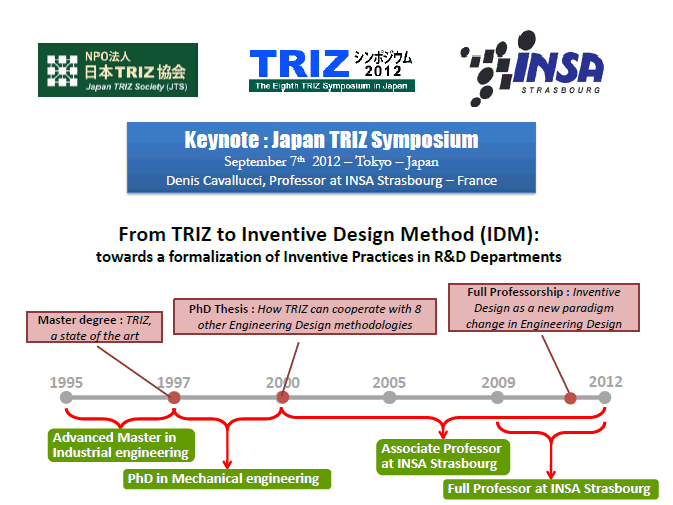
From TRIZ to Inventive Design Method (IDM):
towards a formalization of Inventive Practices in R&D Departments
Denis Cavallucci (INSA Strasbourg, France)
Keynote Lecture at Japan TRIZ Symposium 2012
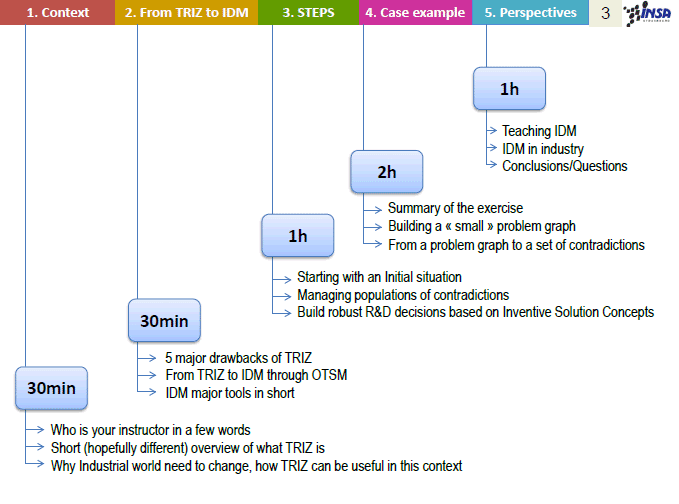
Table of Contents
0. Introduction
1. Context
1A. Who is your instructor in a few words
1B. Short (hopefully different) overview of what TRIZ is
1C. Why Industrial world need to change, how TRIZ can be useful in this context
2. From TRIZ to IDM
2A. 5 major drawbacks of TRIZ
2B. From TRIZ to IDM through OTSM
2C. IDM major tools in short
3. STEPS
3A. Starting with an Initial situation
3C. Build robust R&D decisions based on Inventive Solution Concepts
4. Case example
4A. Summary of the exercise
4B. Building a « small » problem graph
4C. From a problem graph to a set of contradictions
5. Perspectives
5A. Teaching IDM
5B. IDM in industry
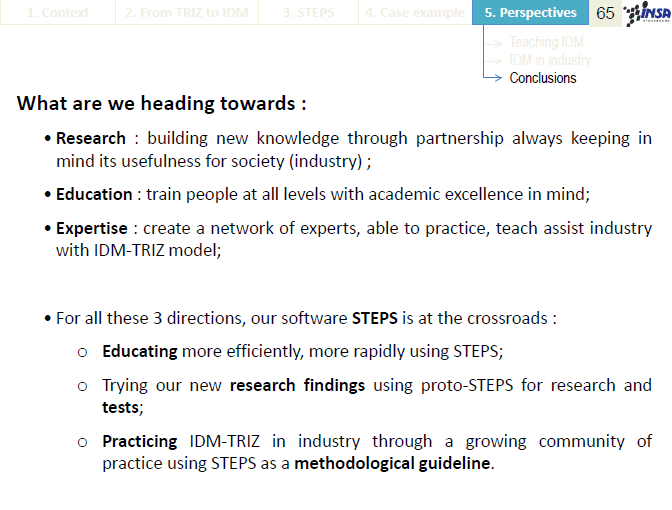
5C. Conclusions
0. Introduction

1. Context
1A.
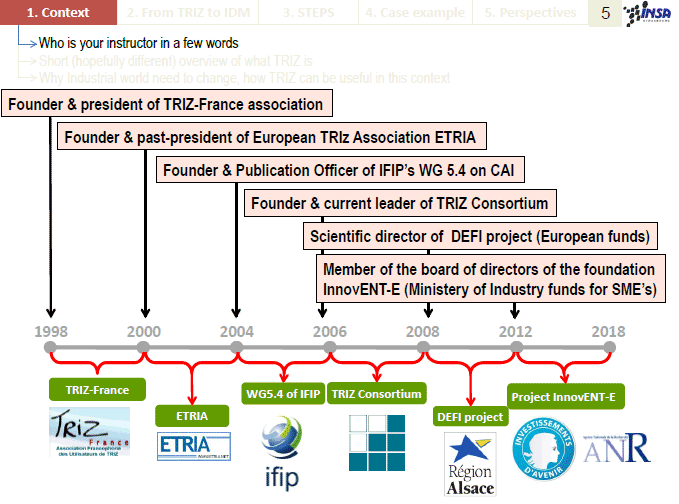
Who is your instructor in a few words

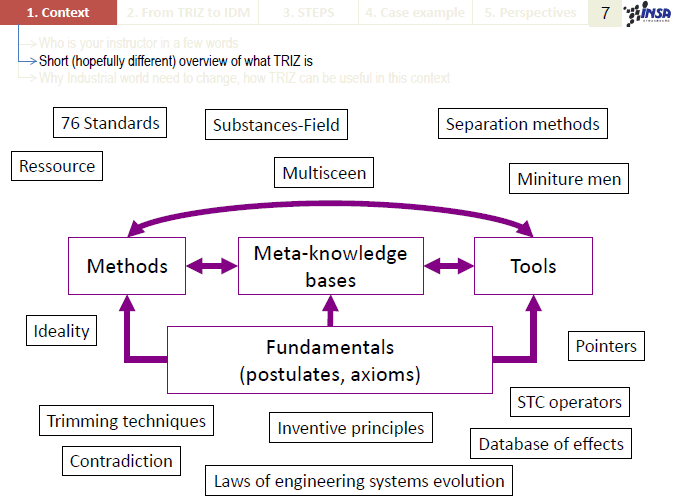
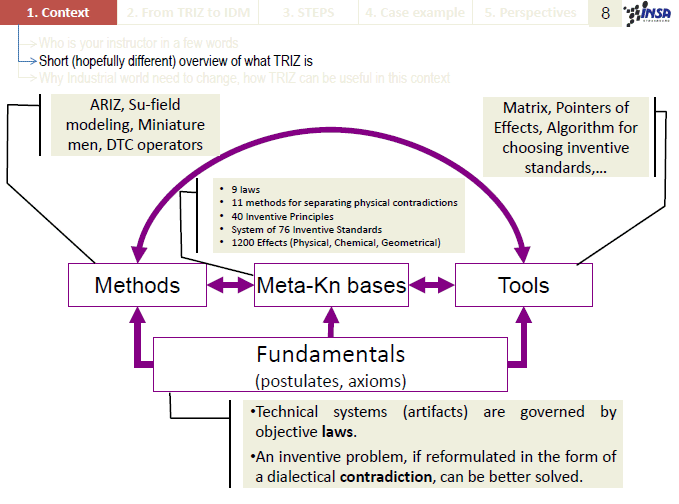
1B. Short (hopefully different) overview of what TRIZ is
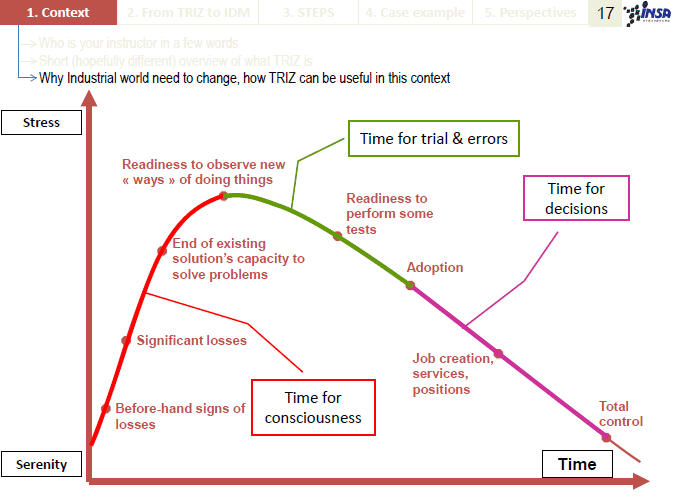
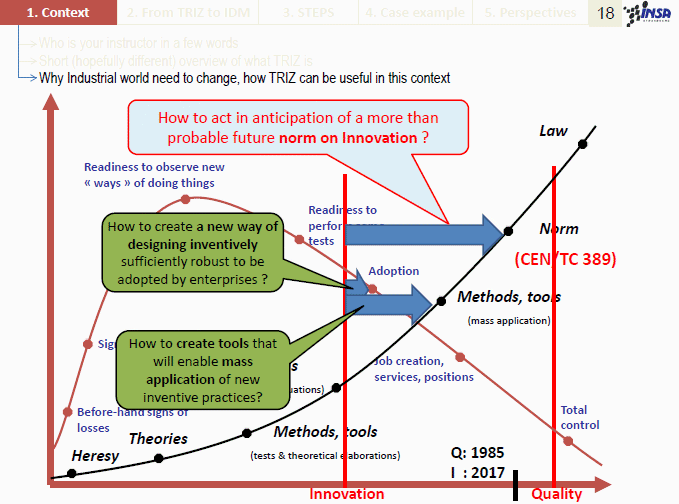
1C. Why Industrial world need to change, how TRIZ can be useful in this context
2. From TRIZ to IDM
2A. 5 major drawbacks of TRIZ

2B. From TRIZ to IDM through OTSM
2C. IDM major tools in short
3. STEPS
3A. Starting with an Initial situation
3C. Build robust R&D decisions based on Inventive Solution Concepts
4. Case example
4A. Summary of the exercise
4B. Building a « small » problem graph
4C. From a problem graph to a set of contradictions
5. Perspectives
5A. Teaching IDM
5B. IDM in industry

5C. Conclusions

Last updated on Dec. , 2018. Access point: Editor: nakagawa@ogu.ac.jp


